Teaching Guide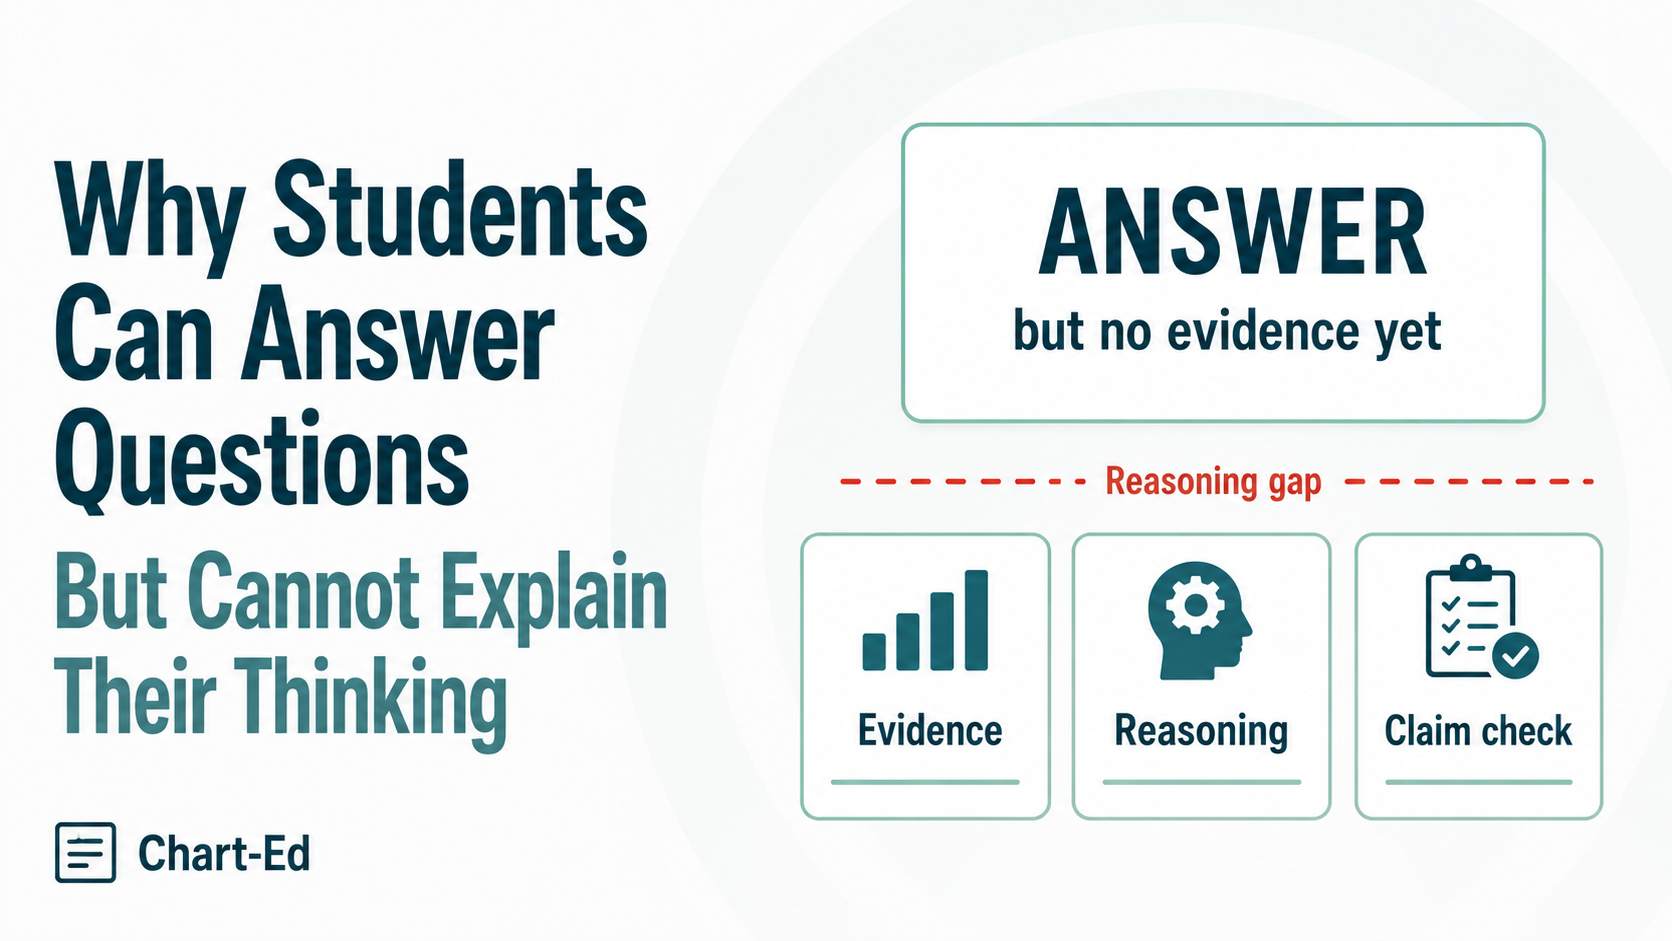
Evidence-Based Reasoning / 6 min read
Evidence-based academic judgment through charts
Chart-Ed helps teachers move students beyond finding values toward explaining patterns, supporting claims, and making justified academic judgments.
Coming soon: classroom kits
The first Data Story investigation, Who Gets What?, helps students use charts, maps, discussion, and evidence to think about opportunity, fairness, and leadership judgment.

A ready-to-teach data investigation for schools preparing students to reason, discuss, and decide from evidence.
The Problem
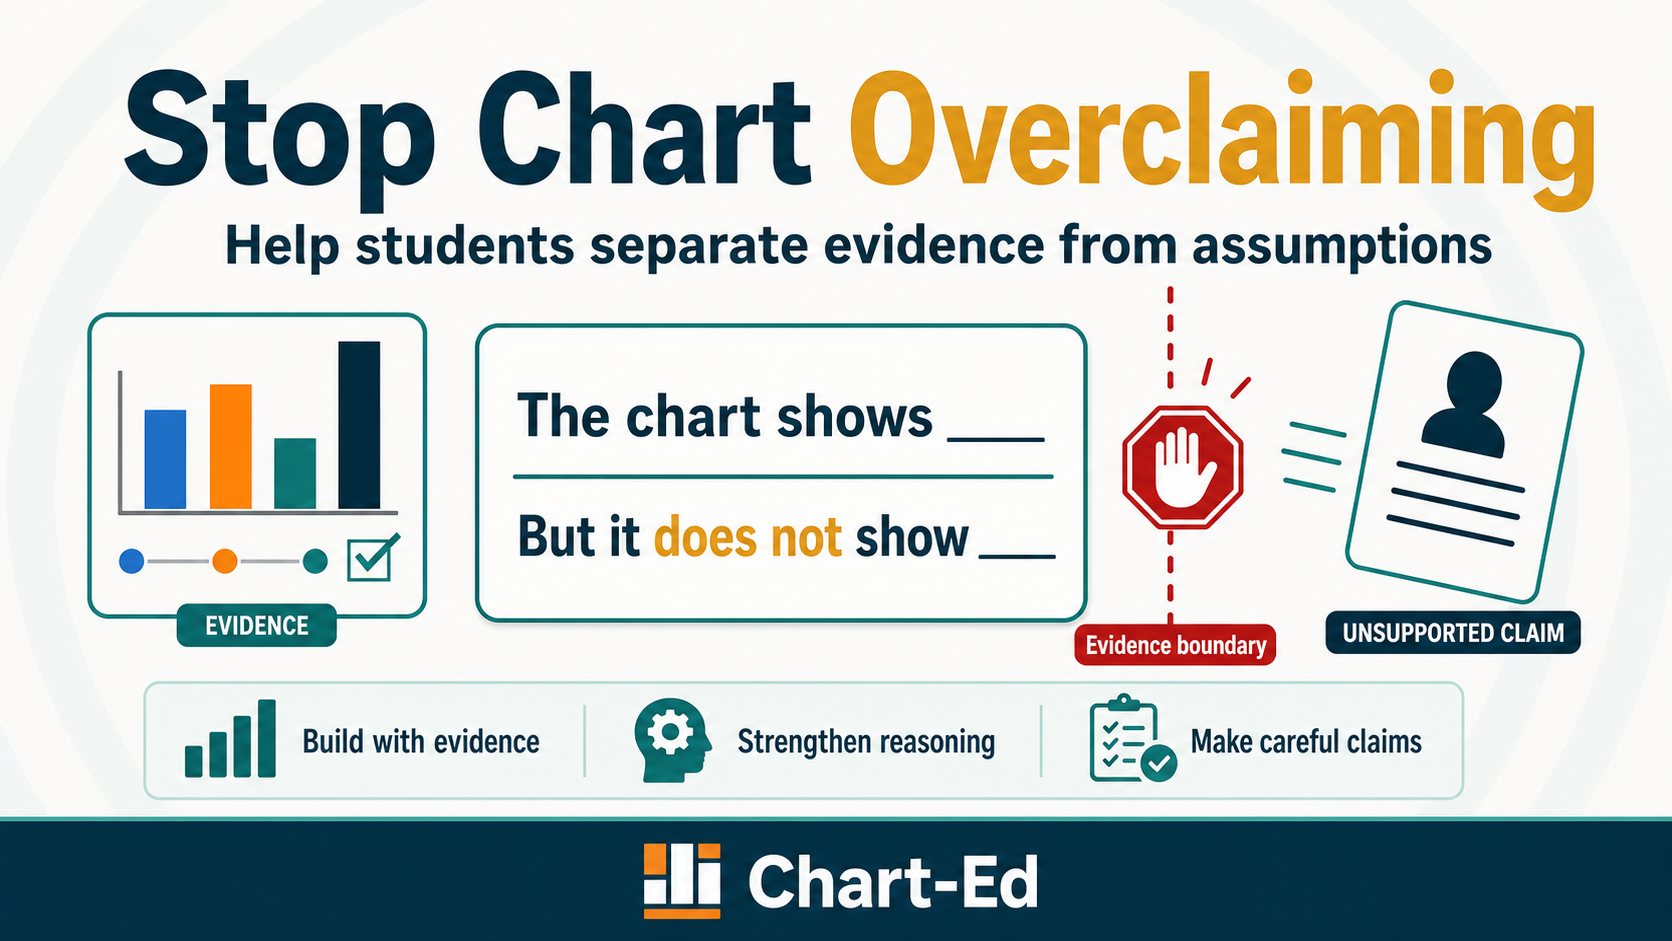
Charts appear in state tests, textbooks, news, science labs, social studies sources, and everyday digital life. But students are often expected to interpret them before they have practiced judging what the evidence actually supports.
Chart-Ed turns that classroom problem into practical instructional products, chart tools, and teacher guidance for helping students notice accurately, interpret carefully, and reason responsibly from evidence.
Teaching guides
Research-informed guides that help you name what students are struggling with, try one practical move, and choose the right Chart-Ed support when you need more structure.
Evidence-Based Reasoning / 6 min read
Graph Interpretation / 7 min read
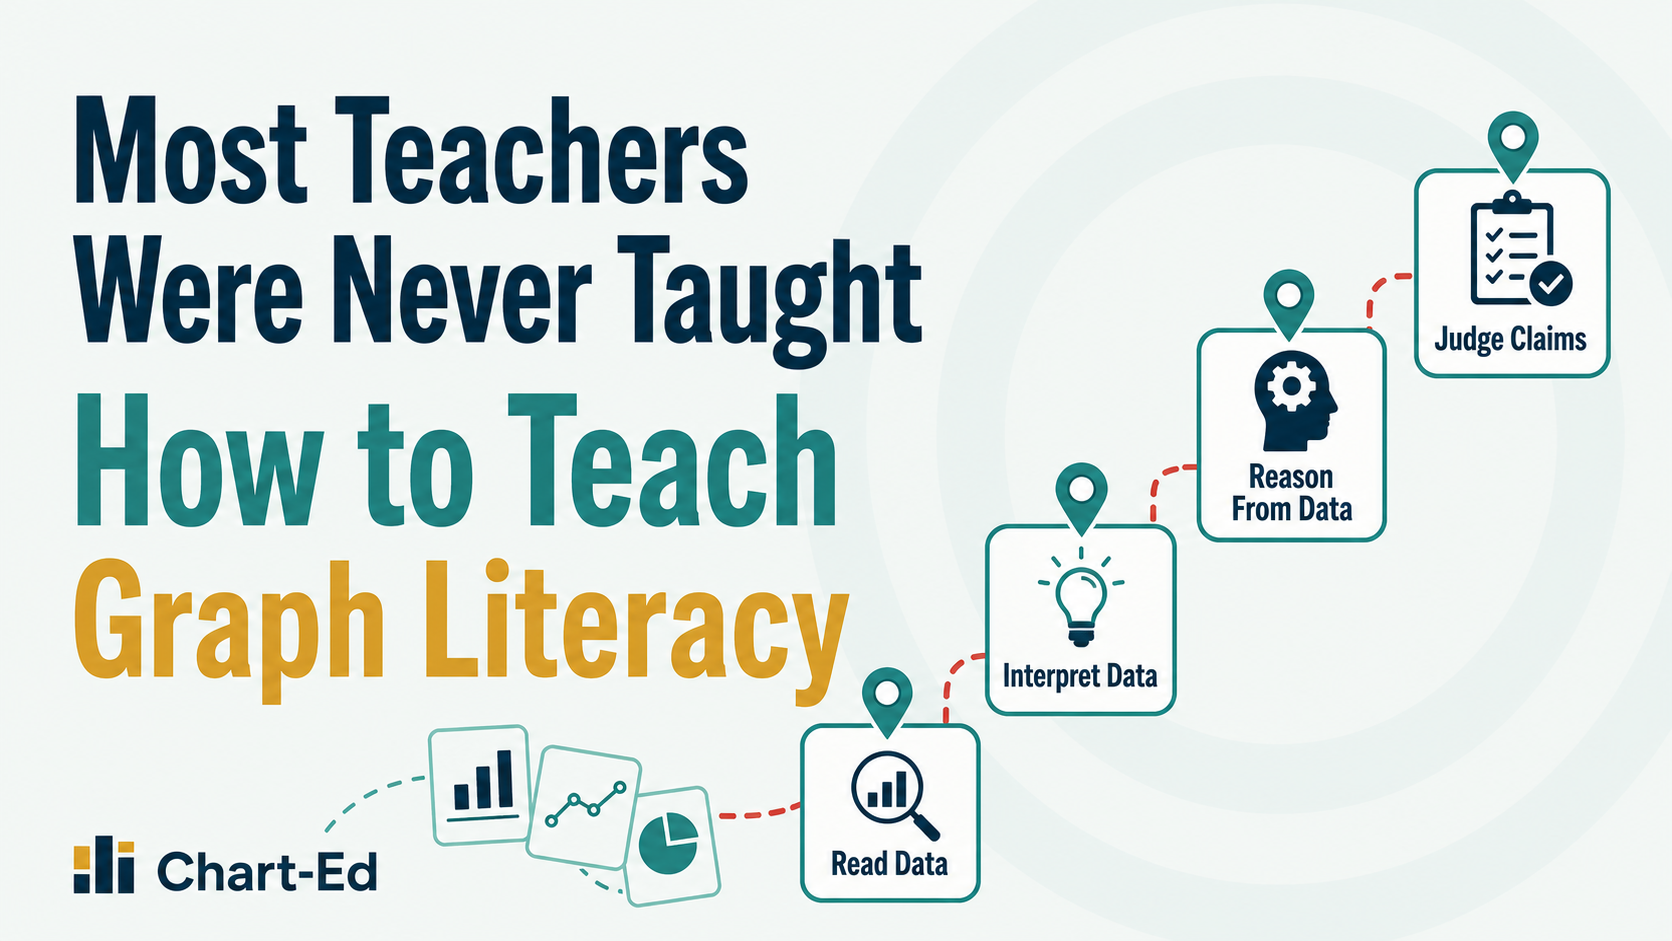
Graph Literacy Instruction / 7 min read
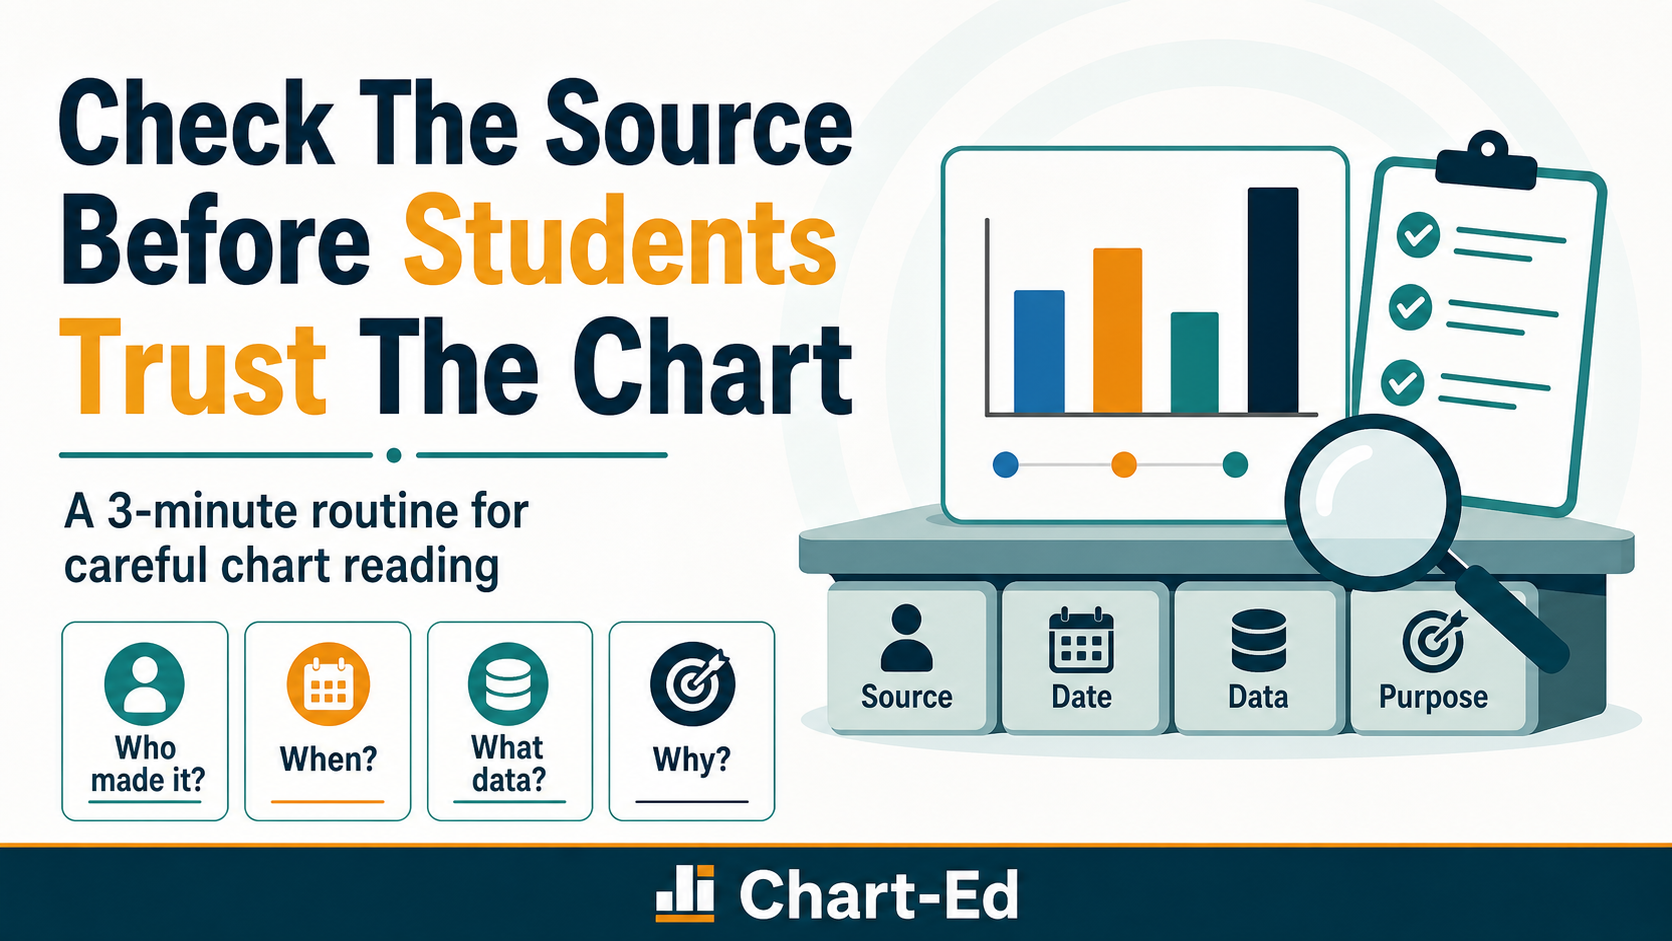
Source Evaluation / 6 min read
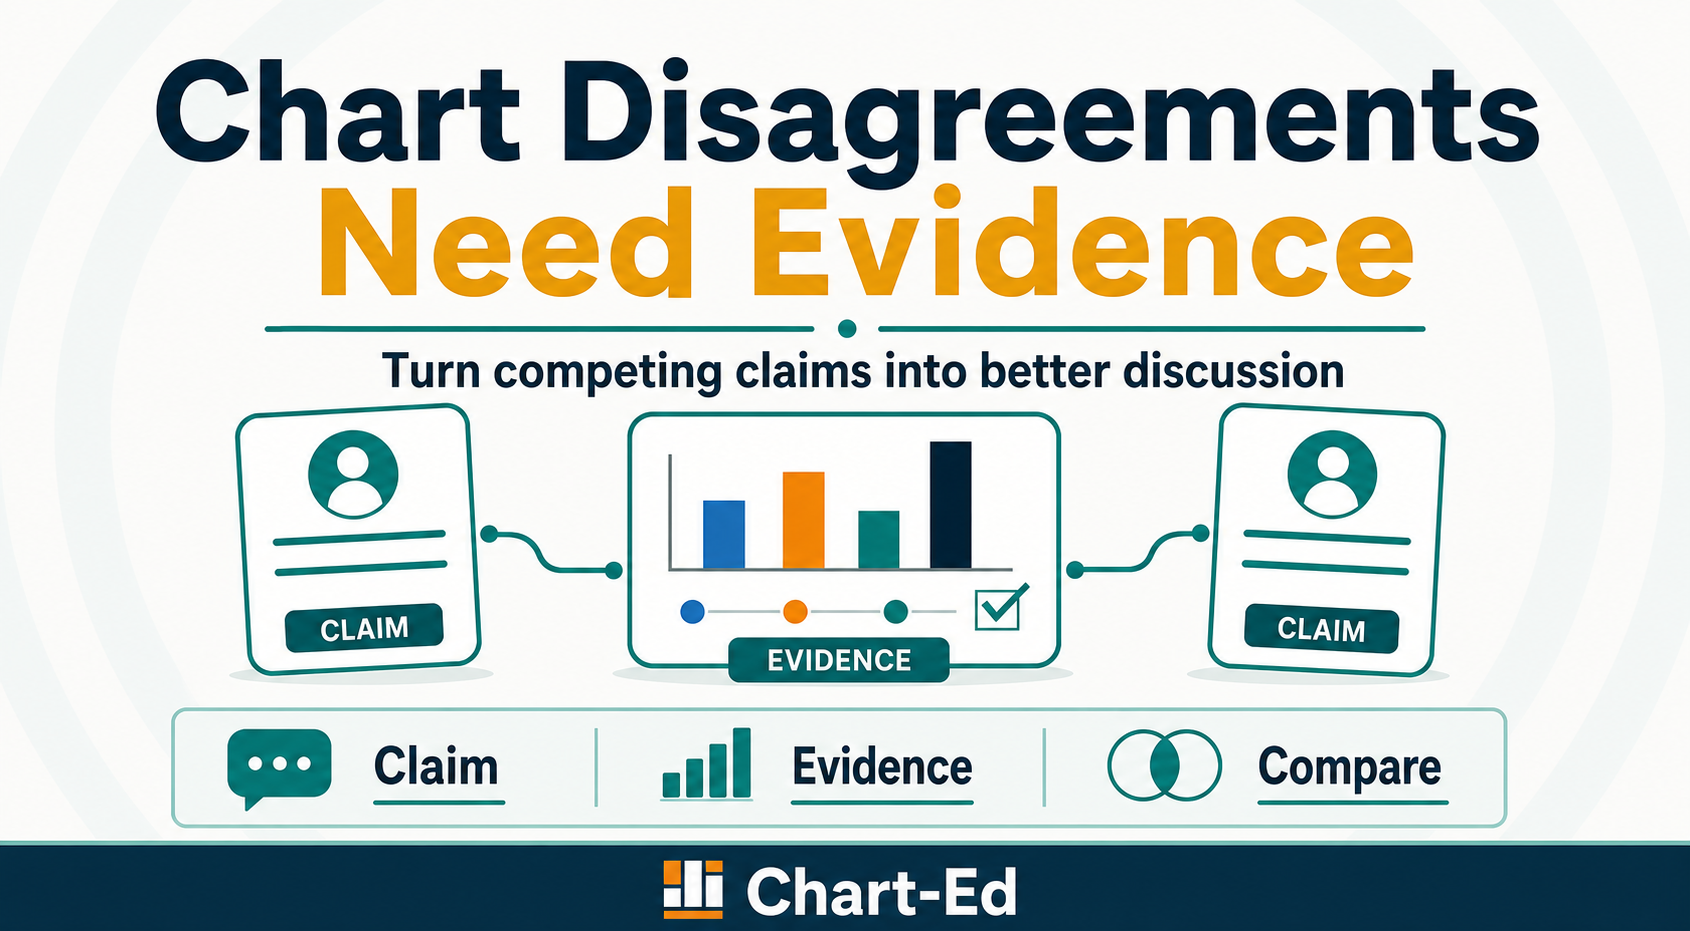
Evidence Discussion / 6 min read
Classroom Resources
Each product line supports a different evidence move: reading accurately, calculating from data, practicing assessment reasoning, or auditing whether a claim is justified.
Core Sequence
Math, science, and social studies · DLL 1-9
$12.99
A governed chart-reading sequence where students notice design choices, read labeled values, make bounded comparisons, and construct chart-authorized claims.
Teaching purposeMost curricula display charts. Data Ascent explicitly teaches students how to read them.
Explore Data AscentMath
Math teachers · DLL 3-6
$10.99
Calculation and justification tasks that require students to extract chart values before they compute, then cite the evidence that authorizes the answer.
Teaching purposeState tests embed math in charts. Data Math bridges calculation skill and evidence-based chart reading.
Explore Data MathTest Prep
Secondary, all subjects · DLL 3-8
from $11.99
Assessment-style chart items built to mirror the format, language, and demand of ACT, SAT, and state exams. Standard focuses on core interpretation; Advanced extends into constructed response, multi-step reasoning, and inference limits.
Teaching purposeMost test prep ignores chart-based reasoning entirely. Students arrive at the exam without practicing the specific skill the exam most reliably tests.
Explore Data Test PrepAP / Honors
AP, honors, and research · DLL 6-8
$13.99
An advanced audit of source credibility, construction choices, inference limits, and the difference between visual impression and evidentiary reach.
Teaching purposeAdvanced students are asked to use data as evidence. Data Forensics teaches them to audit whether the data authorizes the claim.
Explore Data ForensicsOne real-world chart packaged as a coherent sequence from first encounter to forensic audit, with student and teacher editions in one download.
How It Works
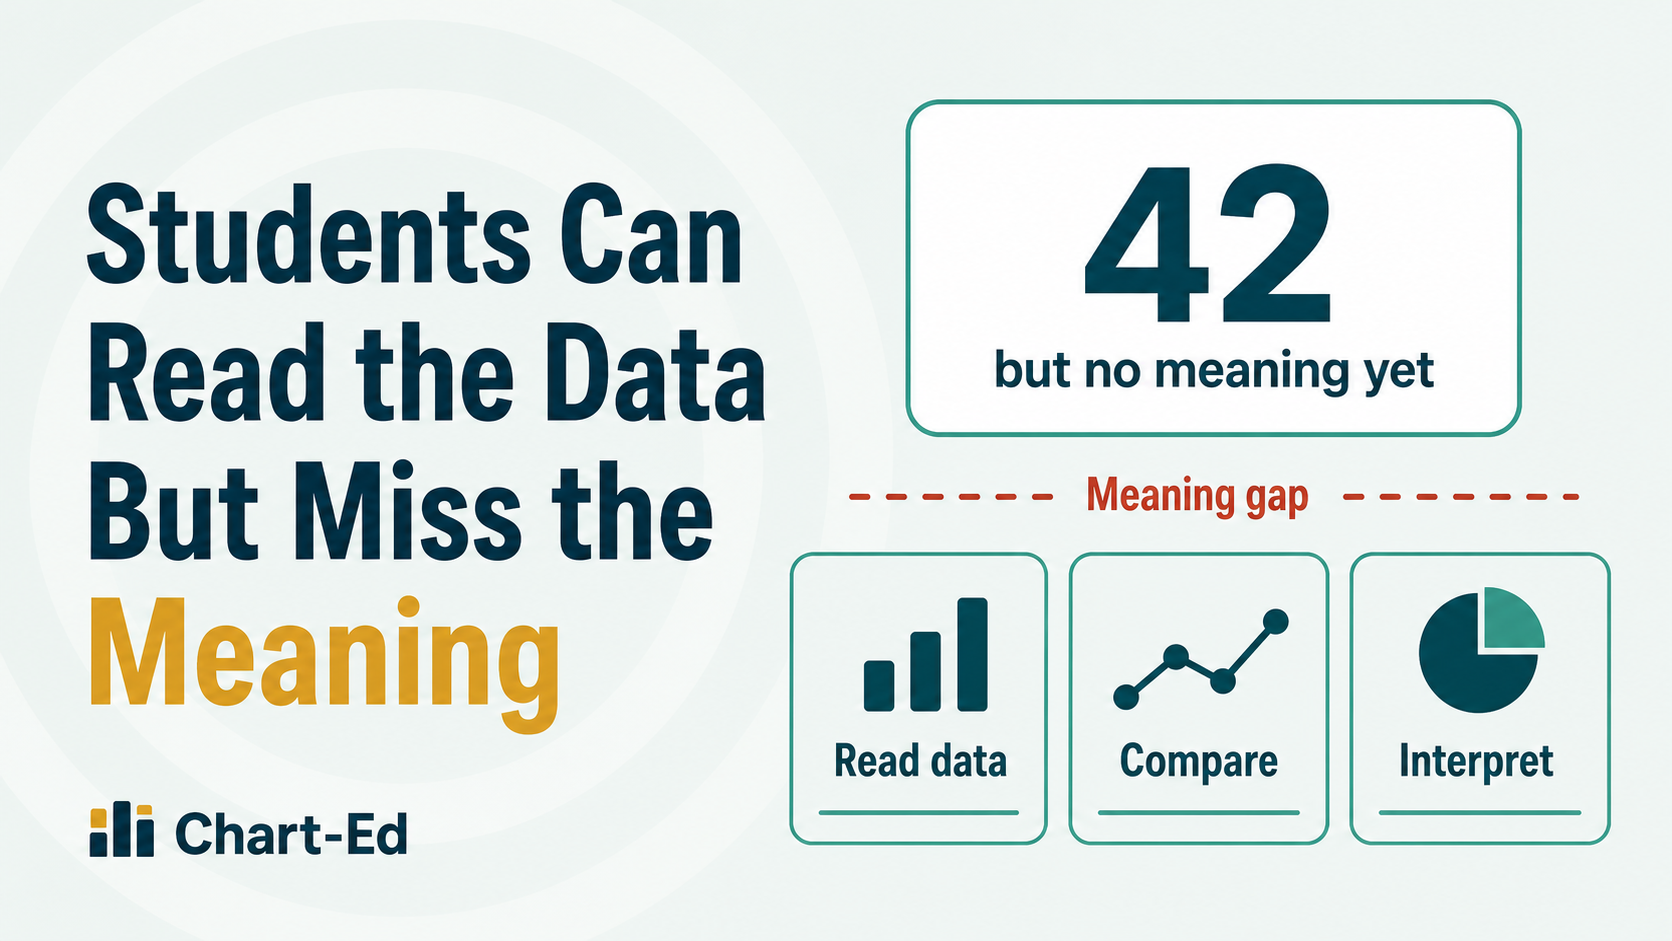
Chart-Ed is organized around a simple instructional idea: students develop academic judgment in stages, and charts make those stages visible enough to teach.
Step 1
Name what students need to decide, justify, or explain from the chart evidence.
Step 2
Use a ready-made chart resource, build a classroom chart, or read guidance for the next classroom move.
Step 3
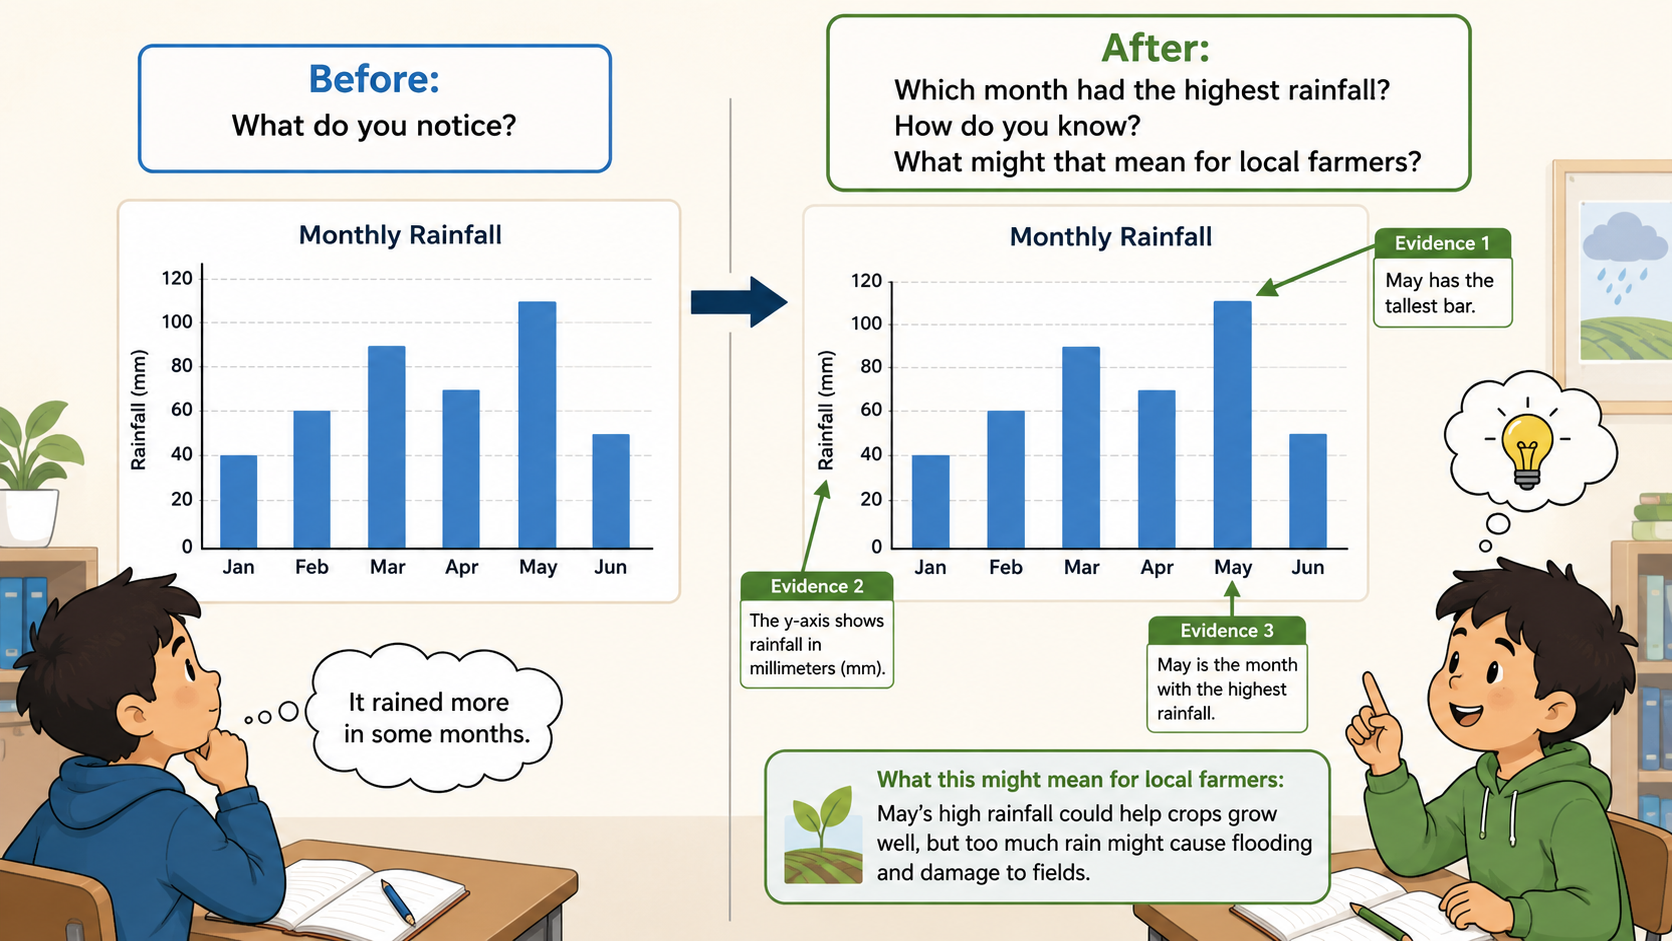
Students work from real charts and learn to say what the evidence shows, not just what they notice.
Step 4
DLL levels make the next instructional step visible, from noticing to justified conclusions.
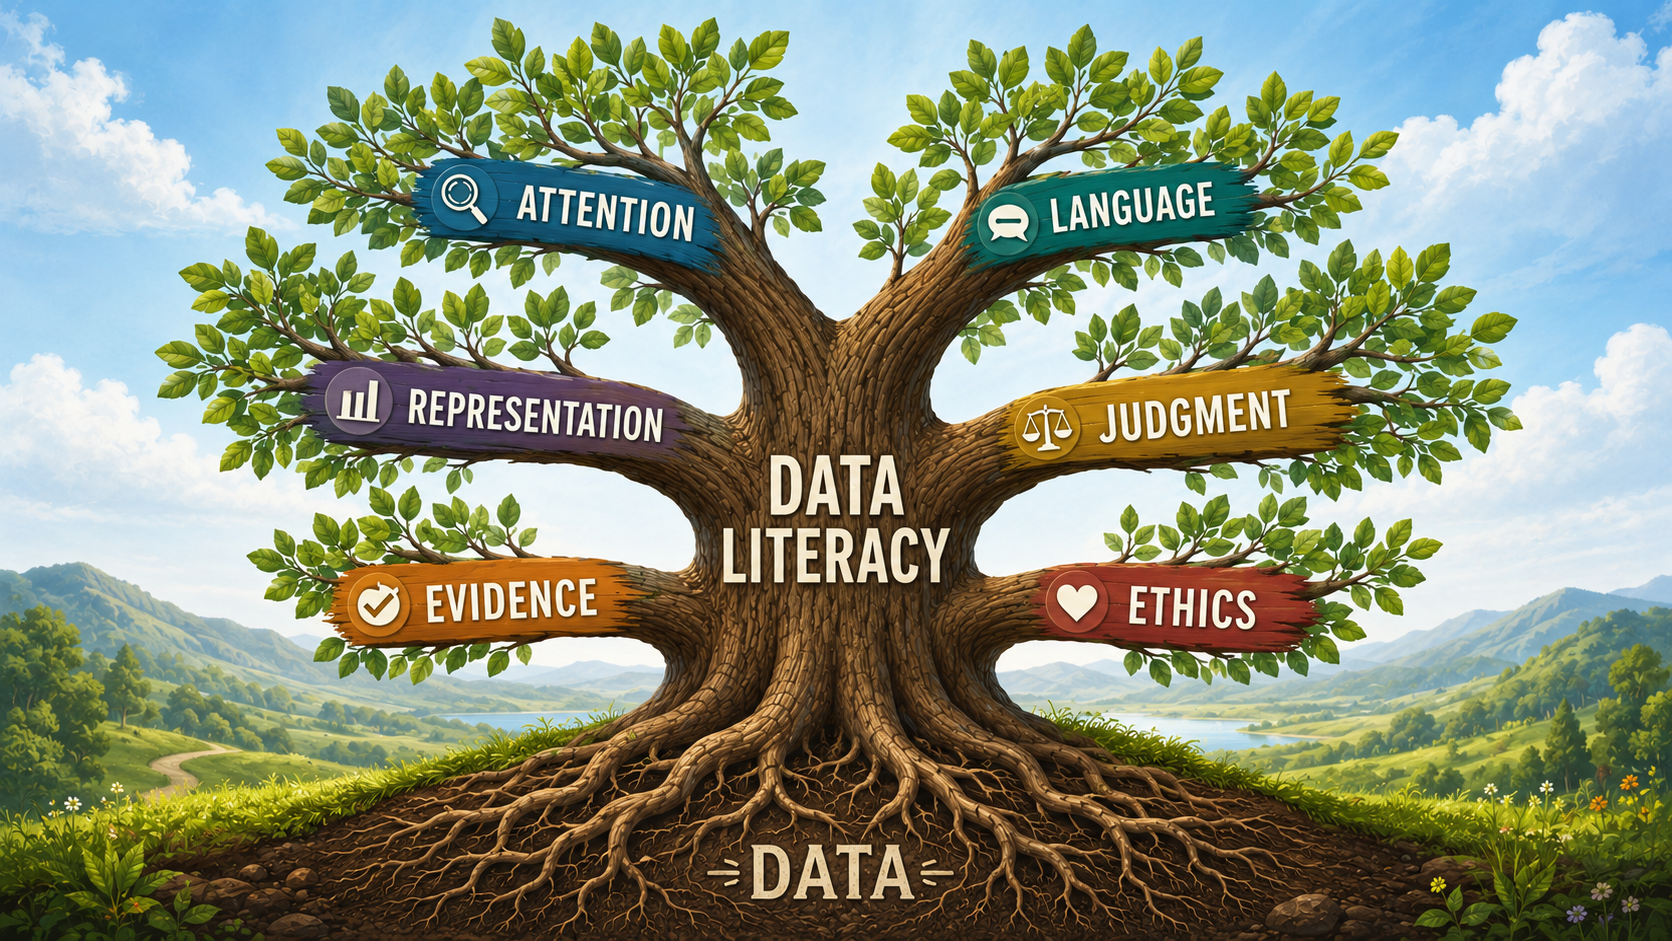
The Data Literacy Standards define what chart literacy looks like at every level of development, from locating a labeled value to auditing whether a chart authorizes a claim. Chart-Ed uses those standards to organize resources, tools, and guidance around the deeper classroom goal: evidence-based judgment.
Who This Is For
Connect computation to the chart evidence students are actually interpreting.
Make chart reading explicit inside the content areas where data already appears.
Give students practice with the chart reasoning exams quietly depend on.
Help advanced students audit whether evidence actually authorizes a claim.
Product carousel
Choose a product line, then scroll across a wider set of available classroom packs.
Data Ascent
Structured chart-reading lessons for helping students notice accurately, orient to a chart, and make evidence-based claims step by step.
Chart generator
Use the Chart-Ed generator to create simple, readable charts for lessons, assessments, displays, and student discussion. Start with one free PNG export, then use credits for additional classroom-ready downloads.
Preview
Field notes
Invite students past first impressions with short notes built for teacher reflection, chart discussion, and practical next moves.
Featured guidance
Foundational Article
From the Chart-Ed Institute

From the Chart-Ed Institute
The Graph Literacy Brief
Teaching Guides, classroom moves, and free resources for helping students reason with evidence.
You will receive Chart-Ed articles, classroom moves, free resources, and product updates. Unsubscribe anytime. Privacy Policy.