Data Literacy Is Not Just Statistics
If you ask most educators what data literacy means, you’re likely to hear answers about graphs, averages, and maybe a spreadsheet. That view, while understandable, sells the concept short—and it shortchanges our students.
True data literacy is a rich and interconnected set of competencies that include attention to where data comes from, the representation of data in charts and stories, evidence reasoning and argumentation, the language used to communicate data results, judgment in making decisions with data, and ethics that govern how data should be used.
Statistics is just one important leaf on a much larger tree. That larger tree is what this article is about.
Grounded in research—much of it from the teacher education literature and international frameworks like PISA—we’ll explore each branch of data literacy, connect it to real classroom moves, and end with a practical self‑assessment so you can reflect on how your current practice hits all six dimensions.
No hype, no jargon: just a richer way to think about what it means for students (and ourselves) to be truly data literate.
The Six Branches of Data Literacy
Six Dimensions Reference Table
| Dimension | Key Question | Try This Activity |
|---|---|---|
| Attention | What should I notice first in this chart or dataset? | Compare two charts on the same topic and identify which features draw attention (titles, colors, scales, annotations). Discuss how those features influence interpretation. |
| Representation | How was this information represented, and what might another representation show? | Convert the same dataset into a bar graph, line graph, and table. Compare what is easier or harder to see in each format. |
| Evidence | What evidence in the data supports this claim? | Give students several claims about a chart. Have them highlight the specific data points that support—or fail to support—each claim. |
| Language | What do the words, labels, and descriptions mean? | Rewrite a chart title, caption, or headline in two different ways and discuss how wording changes interpretation. |
| Judgment | What conclusions can I reasonably draw, and what should I remain uncertain about? | Present a chart with limited context. Ask students to list both valid conclusions and questions that cannot yet be answered from the data alone. |
| Ethics | How might the use or interpretation of this data affect people? | Analyze a real-world dataset and discuss who benefits, who might be overlooked, and what additional information would promote fairness and responsible decision-making. |
Teacher Reflection
The six dimensions work together:
Attention helps students notice data -> Representation helps them understand how it is shown -> Evidence helps them support claims -> Language helps them communicate clearly -> Judgment helps them reason carefully -> Ethics helps them use data responsibly.
This progression moves students beyond simply reading charts toward becoming thoughtful and responsible users of data.
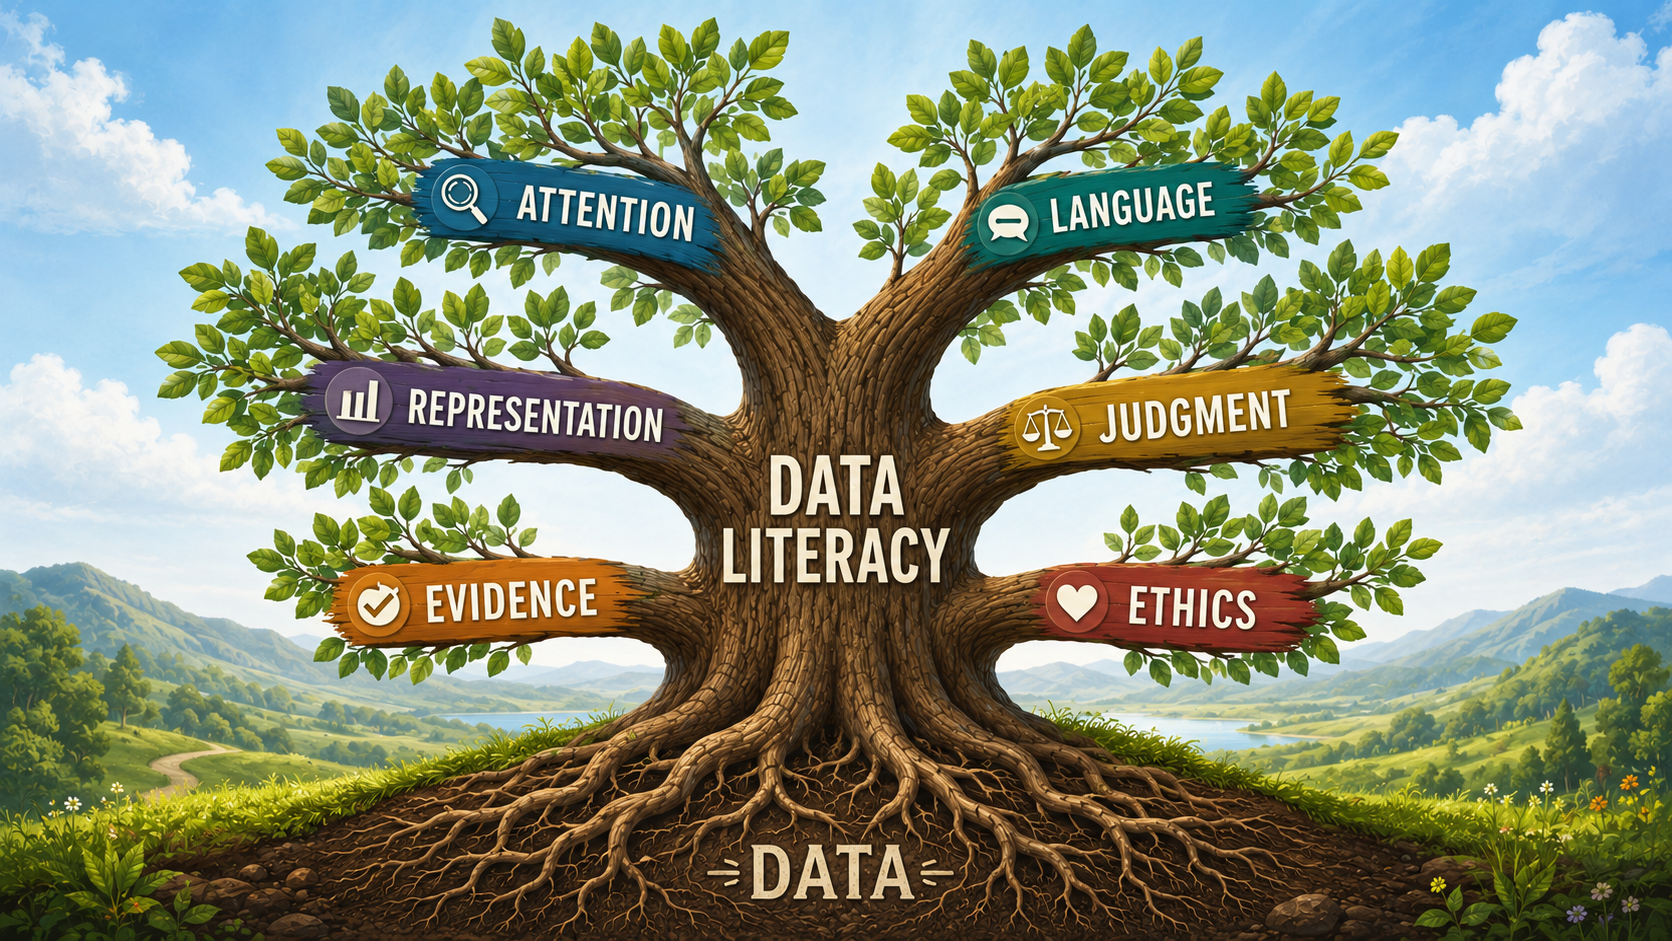
Picture a tree. The roots are labeled “Data,” the trunk says “Data Literacy,” and from it grow six main branches:
- Attention: noticing data quality, source, and provenance
- Representation: creating and critiquing visual displays and data stories
- Evidence: evaluating claims, handling uncertainty, and building arguments
- Language: using words to shape and decode data messages
- Judgment: integrating data with context, values, and trade-offs
- Ethics: considering fairness, privacy, bias, and social responsibility
Statistics doesn’t appear as a separate branch; instead, statistical skills are the smaller leaves that feed every branch. A student who can compute a mean but never asks “Where did these numbers come from?” or “Who is missing from the data?” is only half-literate.
Reflection: Think about the last data activity you did with your class. Which of the six branches were students asked to strengthen? Which ones were assumed, or completely absent?
This framework isn’t pulled from thin air. Mandinach and Gummer (2016) describe teacher data literacy as a broad practice that includes using data effectively and appropriately for instructional decisions. Wolff et al. (2016) argue for a citizen-facing view of data literacy that includes identifying, evaluating, applying, and using data responsibly. International frameworks such as PISA 2022 also treat reasoning with uncertainty and data as central to mathematical literacy, not as an add-on.
A note on evidence: While this framework is grounded in research and expert consensus, not all dimensions have the same depth of direct empirical support. Some, like language and representation, draw on adjacent fields such as media literacy and decision science. The practical strategies offered here reflect current best thinking, not guaranteed outcome formulas.
In the sections that follow, we’ll unpack each branch with concrete classroom examples.
Attention: Seeing Data Before You Count
Data never just “is.” It was collected by someone, for some purpose, using some method, and those choices shape what you can conclude. The first branch of data literacy is the habit of attention: stopping to ask where data came from, what might be missing, and whether it’s trustworthy.
Classroom Vignette (Elementary): Ms. Rivera’s second graders are excited to count the class pets. They make a tally chart: dogs, cats, fish, hamsters. But Joaquin says, “My family has a bird. There’s no bird box.” The class pauses. Did their categories accidentally exclude some pets? How should they adjust the chart? The teacher guides a discussion: “What about pets that don’t fit our boxes? What if someone has no pet? Do we count that?” Even at this age, students are learning that data is constructed, not given.
Try This: Next time you use a data set in class, show students the source first. Ask: “Who made this? Why? What might they have chosen to leave out?” Even a five-minute discussion builds the attention muscle.
Research supports this broader view. Wolff et al. (2016) frame data literacy for a data-driven society as involving more than calculation, including the capacity to identify, evaluate, and apply data responsibly. Mandinach and Gummer (2016) likewise emphasize that educators need to work with data effectively and appropriately, not simply compute with it.
Representation: The Stories Charts Tell
A bar chart isn’t just a picture of numbers; it’s an argument. The choice of axis scale, chart type, and even color can nudge us toward one interpretation or another. The representation branch is about learning to both read and write data visualizations deliberately.
Classroom Vignette (Middle School): Mr. Chen shows his seventh graders an advertisement for a weight-loss supplement. The bar chart looks impressive until students notice the y-axis starts at 120, not 0. The seemingly dramatic difference between “Before” and “After” largely evaporates when they redraw the graph with an honest axis. The class discusses: Why would the advertiser choose that design? What other elements, such as color or size, influence the message? Then students write a short paragraph explaining how the honest graph changes the story.
This exercise weaves representation with language and ethics.
Try This: Grab a misleading graph from news or advertising. Challenge students to redraw it honestly and then create an alternative, equally honest visualization that highlights a different but true aspect of the same data. Discuss which version feels most persuasive and why.
When you’re ready to scaffold visualization skills more systematically, Chart-Ed’s Evidence Builder resource can serve as a bridge between raw data and persuasive communication. Public links for this resource should be added only after the destination URL is confirmed.
Evidence: Arguments, Not Just Answers
A student can compute an average perfectly and still be unable to use it to support a claim, recognize when an outlier calls the average into question, or decide what degree of certainty is warranted. Evidence reasoning is the branch where data meets argumentation and critical thinking.
Research Anchor: NCTM’s Catalyzing Change (2020) encourages students to use data to make informed decisions and critique arguments. PISA 2022 frames mathematical literacy as including reasoning in situations involving uncertainty and data (OECD, 2023).
Classroom Activity Suggestion: Give small groups a set of “data cards”—a mix of summary statistics from a fictional study, including mean, median, range, sample size, and a note about how data were collected. Ask them: “All things considered, would you recommend this medication to a friend? Defend your answer with evidence from the cards, and also point out what you don’t know that might change your mind.”
This low-stakes debate moves students beyond calculation and into the realm of evidence-based arguments. Research on student modeling and argumentation (Lehrer & Schauble, 2005) suggests that such argumentative contexts can help students develop richer ways of reasoning from data. They begin to see data not as a set of right answers but as a tool for constructing reasoned, imperfect claims.
Language: Words That Shape Data Meaning
Numbers rarely speak for themselves. They travel in sentences, headlines, and captions that can amplify, soften, or even reverse their message. Data literacy therefore includes a sensitivity to language: recognizing how word choice frames data and learning to choose words carefully when communicating results.
Try This Activity: Collect a handful of news headlines that report on the same statistical finding, such as “City Crime Drops 5%” and “Violent Offenses Still Worry Residents.” Ask students to read the underlying data report, then discuss: How does each headline’s word choice shape the reader’s takeaway? Next, have them write their own headline that accurately reflects the data but emphasizes a different angle.
This kind of activity draws on adjacent work in data reasoning and media literacy and helps students become more critical consumers of data-driven news.
Reflection: The next time you share a data point with your class, pause and ask: “If I had chosen a different word here, how might my students’ perceptions change?” Model that linguistic awareness for them.
Judgment: Data-Driven Decisions That Matter
You’ve collected high‑quality data, represented it honestly, evaluated the evidence, and communicated clearly—and still the decision might be wrong. Judgment is the branch that integrates data with context, values, and trade‑offs. It’s what keeps us from blindly following a dashboard off a cliff.
Scenario‑Based Activity: Present a messy, realistic situation: A school committee must choose between two reading intervention programs. Program A shows higher average gains but costs significantly more and requires additional teacher training. Program B is cheaper and easier to implement, but its evidence base is thinner.
Give students summary data for both, along with the school’s budget and improvement goals. Ask them to make a recommendation and justify which trade‑offs they are willing to accept. There is no single “correct” answer; the value is in the reasoning.
Mandinach & Gummer’s (2016) work with teachers repeatedly shows that data‑driven decision‑making relies as much on professional knowledge and values as on statistical skill. PISA’s contextual problems similarly require students to consider real‑world constraints, not just compute.
Ethics: The Hidden Responsibility
Data isn’t neutral. It reflects the choices of those who collect and analyze it, and it can perpetuate harm when used carelessly. Ethical data literacy means understanding issues of privacy, consent, bias, and fairness, and feeling a sense of responsibility to act.
High School Vignette: In Mr. Patel’s senior government class, students read a case study about a city that adopted predictive policing software. The software used historical arrest data, but arrest patterns reflected racially biased policing practices. Students research and debate the ethical implications: Who is harmed? Who benefits? Could a better data collection method mitigate some of these harms?
Philip, Olivares-Pasillas, and Rocha (2016) show how data visualizations in classrooms can become sites where students must reason about data and race together. That makes ethical critique of data sources and algorithms a central data-literacy practice, especially when data systems affect historically marginalized communities.
Framing Point: The ISTE Standards for Students emphasize safe, legal, and ethical decisions in digital environments, along with protecting digital privacy and managing personal data and security. Ethics isn’t a special topic for one day; it is woven into every data interaction.
Putting It Together: Designing Learning for the Whole Tree
These branches don’t grow in isolation. A single rich task can touch several at once. Consider a professional-development scenario that many teachers will recognize.
Case: Faculty Data Team. A middle school team is asked to analyze attendance data to identify students who may need support. Before they even open the spreadsheet, several issues surface:
- Attention: Is the attendance record complete? Some students are absent because they’re on field trips or at pull-out services, but the system codes them the same as unexcused absences.
- Language: What label are they using for these students? “Chronically absent” carries a different connotation than “often away.”
- Judgment: The data show a spike in absences during a two-week period that coincides with a family cultural holiday. Should those days count the same way?
- Ethics: Will sharing the list create unintended labels or violate privacy? Who gets to see the data?
The team’s deep discussion simultaneously exercises attention, language, judgment, and ethics, much more than statistical calculation. This kind of holistic data reasoning is what we want for students, too.
What Educators Can Do Tomorrow
Here’s a simple self-assessment to gauge where your instruction currently lands. Check the statements that feel true of your typical data tasks this semester.
- Students regularly ask or are prompted to ask: “Where did this data come from? How was it collected?”
- Students create and critique visualizations, not just interpret them.
- Students use data to support or challenge a claim, with explicit attention to uncertainty.
- Students discuss how word choice in a headline or caption influences their understanding of a data story.
- Students practice making decisions when data is messy, incomplete, or points in different directions.
- Students examine ethical dilemmas related to data privacy, bias, or fairness.
Even one unchecked box can be a starting point. Choose a dimension you haven’t intentionally taught and try one of the “Try This” activities from this article. Small shifts accumulate.
If you’re ready to go deeper, Chart-Ed’s ecosystem of resources—activity templates, formative assessment tools, and professional learning modules—is built around this broad vision of data literacy, grounded in our Living Spiral philosophy of continuous, ethical growth. Public resource links should be added only after their destination URLs are confirmed.
Data literacy is not just statistics. It’s a way of seeing and acting in a data-saturated world. And the moment we teach it that way, we equip our students not only to work with numbers but to think critically, communicate clearly, and act ethically. That’s a literacy worth teaching.
References
- Mandinach, E. B., & Gummer, E. S. (2016). Data Literacy for Educators: Making It Count in Teacher Preparation and Practice. Teachers College Press.
- Wolff, A., Gooch, D., Cavero Montaner, J. J., Rashid, U., & Kortuem, G. (2016). Creating an understanding of data literacy for a data-driven society. The Journal of Community Informatics, 12(3), 9–26.
- National Council of Teachers of Mathematics. (2020). Catalyzing Change in High School Mathematics: Initiating Critical Conversations. NCTM.
- OECD. (2023). PISA 2022 Assessment and Analytical Framework. OECD Publishing.
- Philip, T. M., Olivares-Pasillas, M. C., & Rocha, J. (2016). Becoming racially literate about data and data-literate about race: Data visualizations in the classroom as a site of racial-ideological micro-contestations. Cognition and Instruction, 34(4), 361–388. https://doi.org/10.1080/07370008.2016.1210418
- Lehrer, R., & Schauble, L. (2005). Developing modeling and argument in the elementary grades. In T. A. Romberg, T. P. Carpenter, & F. Dremock (Eds.), Understanding Mathematics and Science Matters (pp. 29–53). Lawrence Erlbaum Associates.
- Rubin, A. (2020). Learning to reason with data: How did we get here and what do we know? Journal of the Learning Sciences, 29(1), 154–164. https://doi.org/10.1080/10508406.2019.1705665
- International Society for Technology in Education. (2026). ISTE Standards: For Students. ISTE.