Why Chart Titles Are Not Enough
A chart’s title can give us a false sense of understanding. Before students jump to conclusions, they need a simple, repeatable routine to inspect what’s really in front of them. Here’s a classroom-friendly approach that goes beyond the headline.
The Title Trap: Why First Impressions Can Mislead
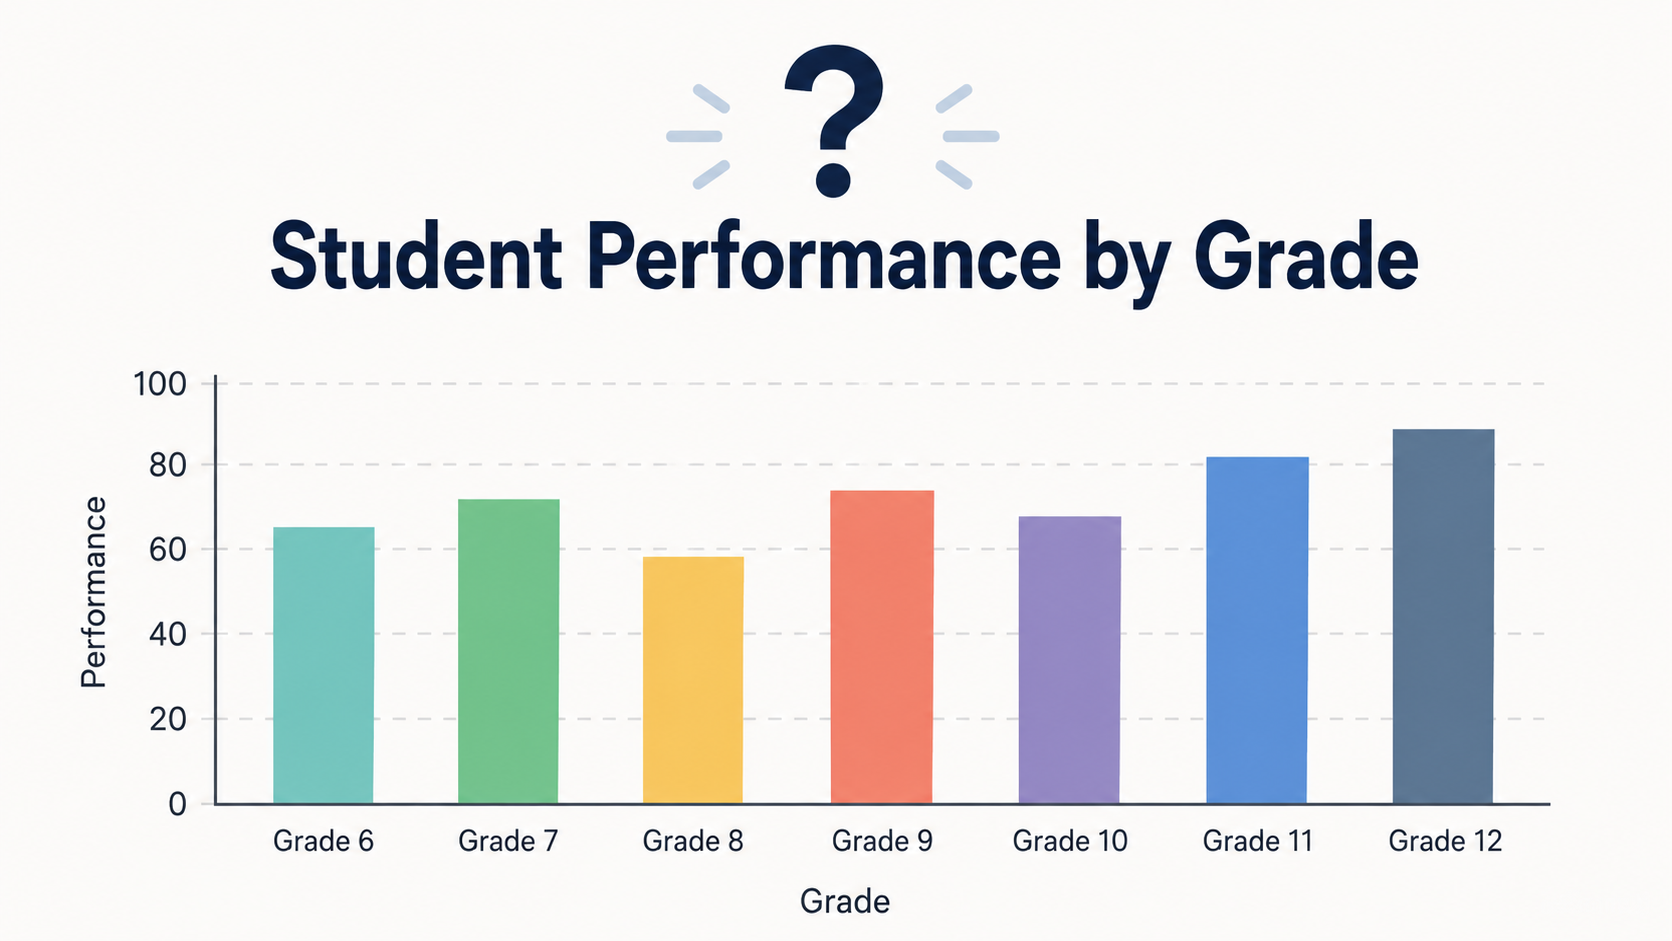
Picture this: you display a bar chart titled **“Student Performance by Grade.” ** A student immediately says, "Oh, fifth graders are doing the best."
But the axes reveal something else—maybe the bars show number of students tested, not average scores; maybe the scale starts at 80 instead of zero; maybe the source is an advocacy group with a particular stance. The title alone can oversimplify or even mislead.
As educators, we know that critical data literacy isn’t about memorizing definitions—it’s about building habits of careful inspection. And it starts with teaching students to look beyond the headline.
The Chart Skeleton: A Quick Scan Routine
Give students a consistent, memorable routine: “Before you react, scan the skeleton.” Model it each time you encounter a chart:
- Axes – What is being measured on each axis? Are the numbers counts, percentages, or something else?
- Units – What increments are used? Does the scale start at zero, or is it truncated? Are the intervals equal?
- Source – Who created this chart? When? A reputable source can still have a point of view; a vague source is a red flag.
- Categories – What do the colors, bars, or lines represent? Are categories clearly labeled, or are you guessing?
- Labels – What other text, footnotes, or annotations might change the meaning?
This “skeleton scan” works for nearly any chart type—bar, line, pie, infographic—and doesn’t require advanced math.
Making It Stick: Modeling the Routine in Your Classroom
- Start small. Tomorrow, put up a simple chart (from a textbook, news site, or Chart-Ed’s Chart Bank) and walk through the five steps aloud.
- Turn it into a partner routine. Students exchange charts and ask each other, “What might be hidden here?” or “What would you change to make it clearer?”
- Make it visual. Keep an anchor chart in the room listing the five skeleton checks.
- Keep it low-stakes. The goal is habit, not perfection. Praise curiosity, not just “correct” interpretations. Over time, students will start doing the scan on their own—and catch things you might have missed.
Take the Next Step
Try the “scan the skeleton” routine with your next classroom chart. For fresh, discussion-worthy charts, explore Chart Bank—it’s full of curated examples that reward careful inspection. And if you’re ready to build durable data skills across your school, see how Data Ascent supports that journey. Share your experience with colleagues or drop us a note—we’d love to hear how it goes.