Ask This Before Students Explain a Pattern
Students are often quick to tell you what a chart means. They spot a pattern, and the explanation leaps out. But do they stop to examine what the chart actually shows? In many classrooms, the rush to explain can lead to surface-level analysis and misplaced trust in data visualizations. That’s why a simple pause question can shift student thinking from “What does this mean?” to “What evidence am I looking at?” Introducing:
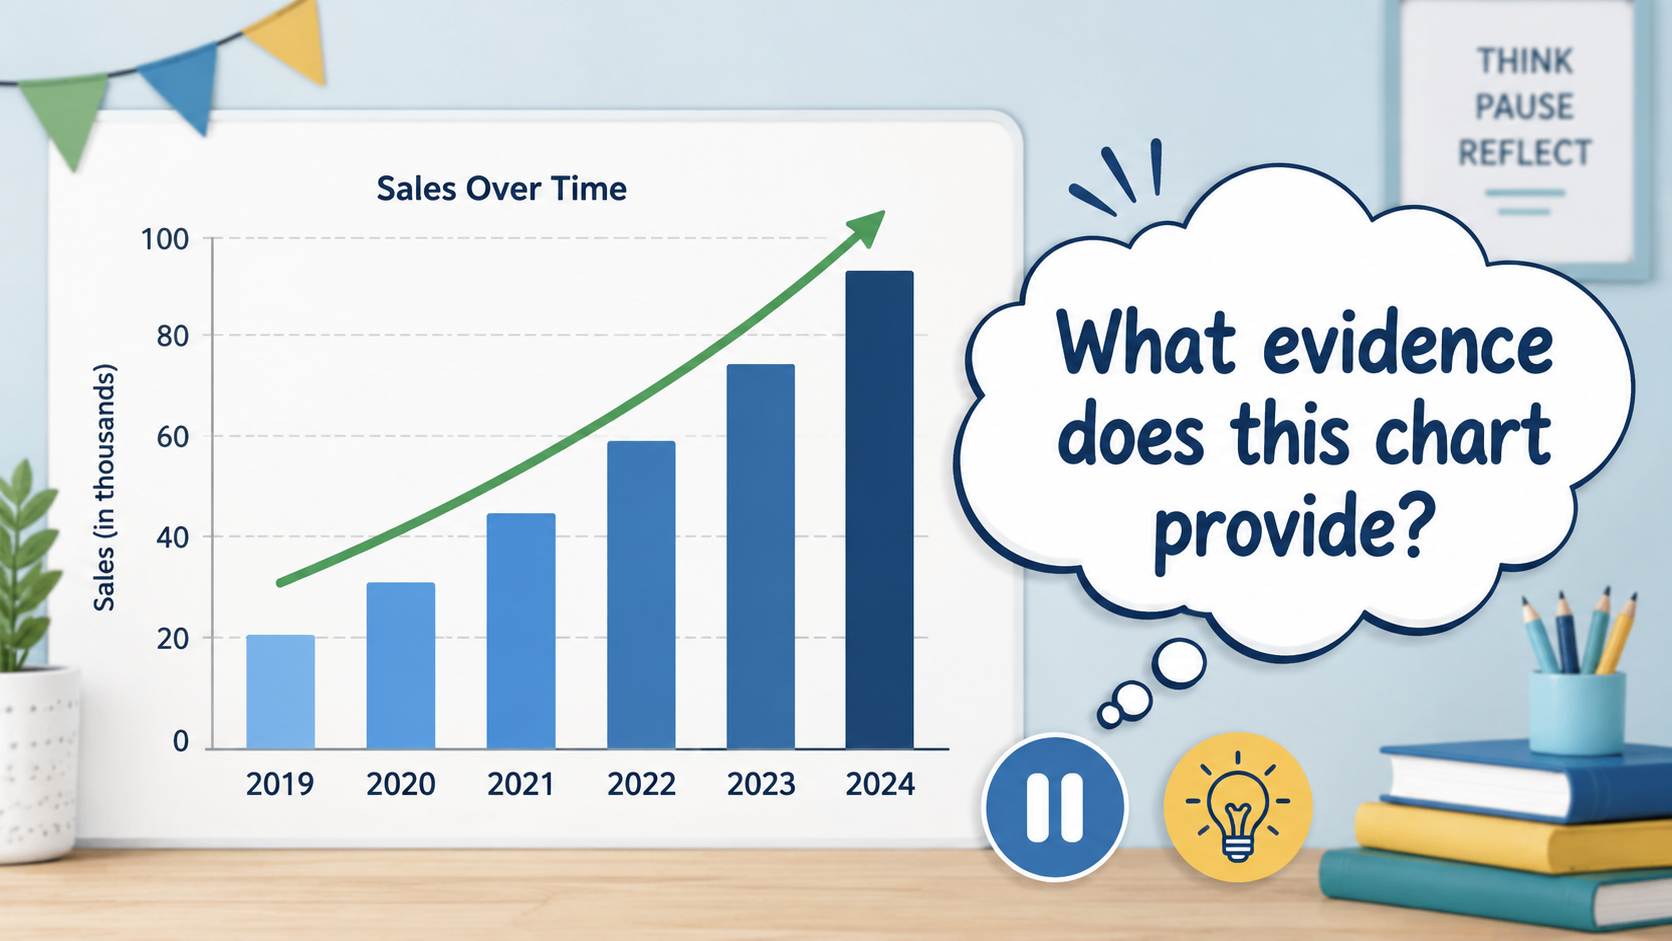
What evidence does this chart provide? This one question redirects students’ attention back to the data before they jump to an interpretation. It’s quick, works in any subject, and builds a foundation for healthier data skepticism.
The Urge to Explain Too Fast
When you display a graph—a bar chart with rising numbers, a line that dips then spikes—students instinctively want to explain the story. That’s not wrong; it’s natural. But the leap often skips a crucial step: examining the data itself. Without that pause, students might:
- Overlook missing values or truncated axes.
- Confuse correlation with causation.
- Trust a tidy graphic without questioning its construction.
This isn’t about blaming students. It’s about recognizing a habit we can gently interrupt.
One Pause Question That Changes Everything
The move is deceptively simple: before you ask students to explain a pattern, ask them to list the evidence the chart presents.
Example: A bar chart showing “Average Rainfall by Month”
- Rushed explanation: “It rains more in the summer.”
- Pause question: “What evidence do you see in the chart?”
- Evidence-first response: “The bars for June, July, and August are higher than the others—around 80 millimeters—while the bars for winter months are below 30 millimeters.”
Now the explanation is grounded in what the data actually says. The subtle shift from interpretation to observation strengthens reasoning and makes later critical questions (like “Is this graph misleading?”) far easier to pose.
Why This Works in Any Subject
Data shows up in science, social studies, math, health, and even ELA when students encounter infographics. Asking for evidence works across all of them because it doesn’t require subject-specific vocabulary—just a willingness to slow down and look.
- In science: “What evidence does this graph of temperature over time provide?”
- In social studies: “What evidence does this population chart give us?”
- In math: “What evidence does this scatter plot show about the relationship?”
The question builds a transferable habit: evidence first, then explanation. It also takes only seconds and fits seamlessly into any lesson.
Quick Tips for Making It Stick
- Model the move yourself. When you show a chart, think aloud: “Before I explain, let me notice what I’m seeing—higher bars here, a dip there.”
- Redirect premature explanations. If a student starts with “This means…,” say, “Hold on—what evidence are you seeing that makes you think that?”
- Use anchor charts or sentence stems. For younger learners, post: “I see evidence that…” or “The chart shows…”
- Be consistent. Make it the first question every time you display a data visualization. Soon students will internalize the pause.
When They’ve Got the Evidence, Then What?
Once students can articulate the evidence, you’ve opened the door to deeper analysis. They’re ready to evaluate the source, consider missing perspectives, or decide whether the chart supports the claim it’s being used to make. That’s where more structured resources can help.
Chart-Ed’s Data Ascent resource provides scaffolded activities for building data literacy, while Data Forensics guides students through a critical examination of visual evidence—much like detectives at a crime scene. This pause question isn’t the end; it’s the essential starting point.
Try It Tomorrow
The beauty of this move is its immediacy. You don’t need new materials, extra prep time, or special training. The next time you project a chart, pause and ask:
What evidence does this chart provide? Then watch how student responses shift. For more classroom-ready strategies, sign up for our newsletter or explore the companion pillar article: How Students Learn to Trust Data Too Quickly.