Teacher Pain
Students see a chart, notice a real pattern, and then say more than the chart actually supports.
A student might say:
This proves City A cares more about recycling.
But the chart may only show that City A has a higher recycling rate. It does not show motivation, policy, access, incentives, or belief.
That is the classroom problem: students often move from evidence to explanation too quickly.
What Is Really Happening
The student is not necessarily being careless. Charts invite stories.
When students see a trend, gap, increase, decrease, or difference, they naturally want to explain it. That instinct is valuable, but it can also produce overclaiming.
The reasoning problem is this:
The claim becomes stronger than the evidence.
Chart-Ed treats this as an evidence-boundary problem. The chart supports some conclusions. It does not authorize every conclusion that feels plausible.
Classroom Move
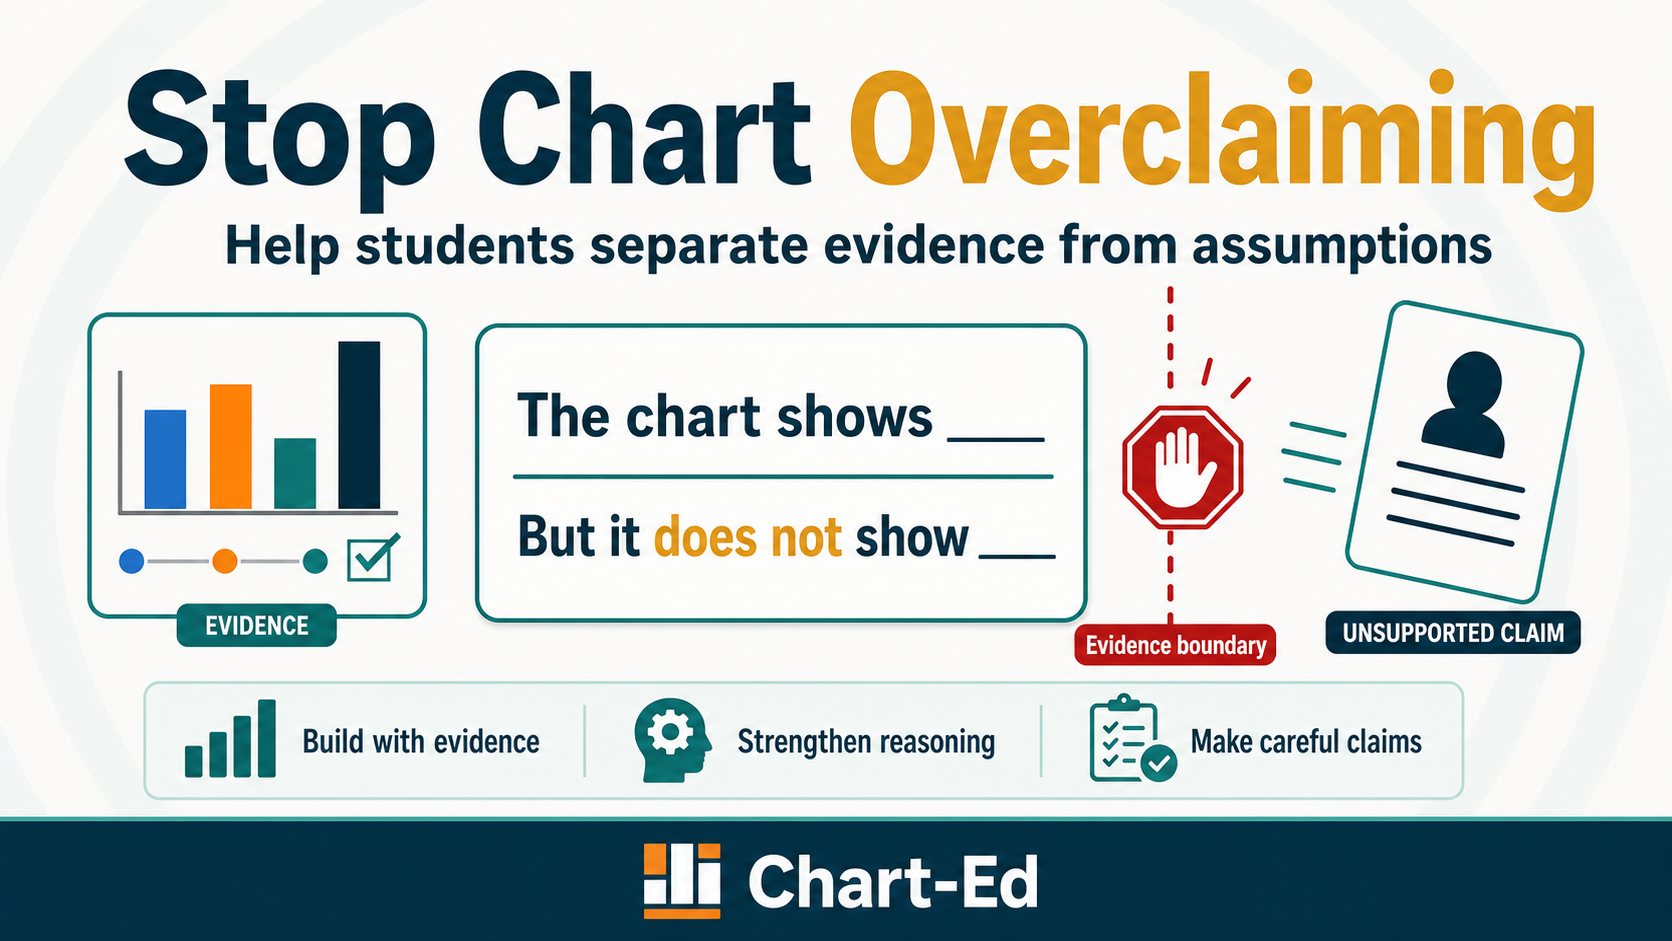
Teach students one sentence:
The chart shows ____, but it does not show ____.
This sentence slows down the leap from observation to assumption.
The first blank names what is visible in the chart. The second blank names what remains outside the evidence.
Example
Imagine a chart titled:
Recycling Rates in Three Cities
The chart shows:
City A: 60%
City B: 40%
City C: 20%
A student says:
City A cares the most about recycling.
Use the frame:
The chart shows that City A has the highest recycling rate and City C has the lowest.

But it does not show why those rates differ or whether people in City A care more about recycling.
The student still gets to interpret. But now the interpretation is constrained by the evidence.
How To Use The Free Resource
Use the Overclaiming Stop Sentence Card when students are about to explain a pattern or make a conclusion from a chart.
Ask students to complete three quick steps:
1. What does the chart show?
2. What does the chart not show?
3. What claim can I make carefully?
This works as a warm-up, exit ticket, discussion routine, assessment review move, or partner-check before students share answers.
Common Mistake To Watch For
Do not let students use the second blank as a way to avoid thinking.
Weak response:
The chart shows City A recycles more, but it does not show anything else.
Stronger response:
The chart shows City A has the highest recycling rate, but it does not show whether that happened because of stronger recycling habits, local policy, easier access, or another factor.
The point is not to say less. The point is to say only what the evidence can support.
Free Resource
Download the Overclaiming Stop Sentence Card
Product Bridge
If you want students to practice this kind of evidence-boundary thinking across multiple chart types, use Chart-Ed Data Forensics.