Many teachers are expected to teach graph literacy.
Far fewer were ever given a clear way to teach it.
That gap matters.
Charts appear in science, social studies, mathematics, ELA informational text, assessments, news, and everyday life. Students are asked to read values, compare patterns, interpret meaning, and judge claims from evidence.
But teachers are often left to assemble those skills from scattered activities:
one graphing worksheet
one data table
one science lab chart
one test-prep question
one social studies infographic
The activities may be useful.
But they do not automatically create a progression.
The Problem Is Not Teacher Effort
When graph literacy instruction feels fragmented, the issue is usually not that teachers do not care.
The issue is that graph literacy sits across several disciplines.
It belongs partly to reading, partly to mathematics, partly to science, partly to social studies, and partly to evidence-based reasoning.
That makes it easy for everyone to assume someone else has already taught it.
Students may encounter charts in many places without ever experiencing a systematic path for becoming more skillful readers and interpreters of data.
What Students Are Actually Being Asked To Do
When students work with a chart, they are rarely doing only one thing.
They may need to:
read labels
understand scale
locate values
compare categories
notice patterns
interpret meaning
identify limits
support claims
avoid overclaiming
That is a lot of intellectual work.
Research on graph comprehension has long distinguished between reading data, reading between data, and reading beyond data. Other work on graph comprehension and statistical reasoning has shown that interpreting graphs depends on multiple interacting features, including the visual form, the task, the reader's prior knowledge, and the reasoning demands of the question.
In other words, chart instruction is not just about showing students more charts.
It is about helping them develop a path from visible information to justified conclusions.
Why Chart Lessons Become Disconnected
Without a roadmap, chart instruction can become occasional:
We do a graph when the textbook includes one.
We discuss data during a science lab.
We review graph questions before the test.
We analyze an infographic when it appears in an article.
Each moment may help.
But students may not see how the moments connect.
Teachers may also struggle to diagnose the source of a student's difficulty.
Is the student struggling to read the axis?
Is the student missing the comparison?
Is the student interpreting the pattern too quickly?
Is the student making a claim the chart does not support?
Those are different problems.
They need different instructional responses.
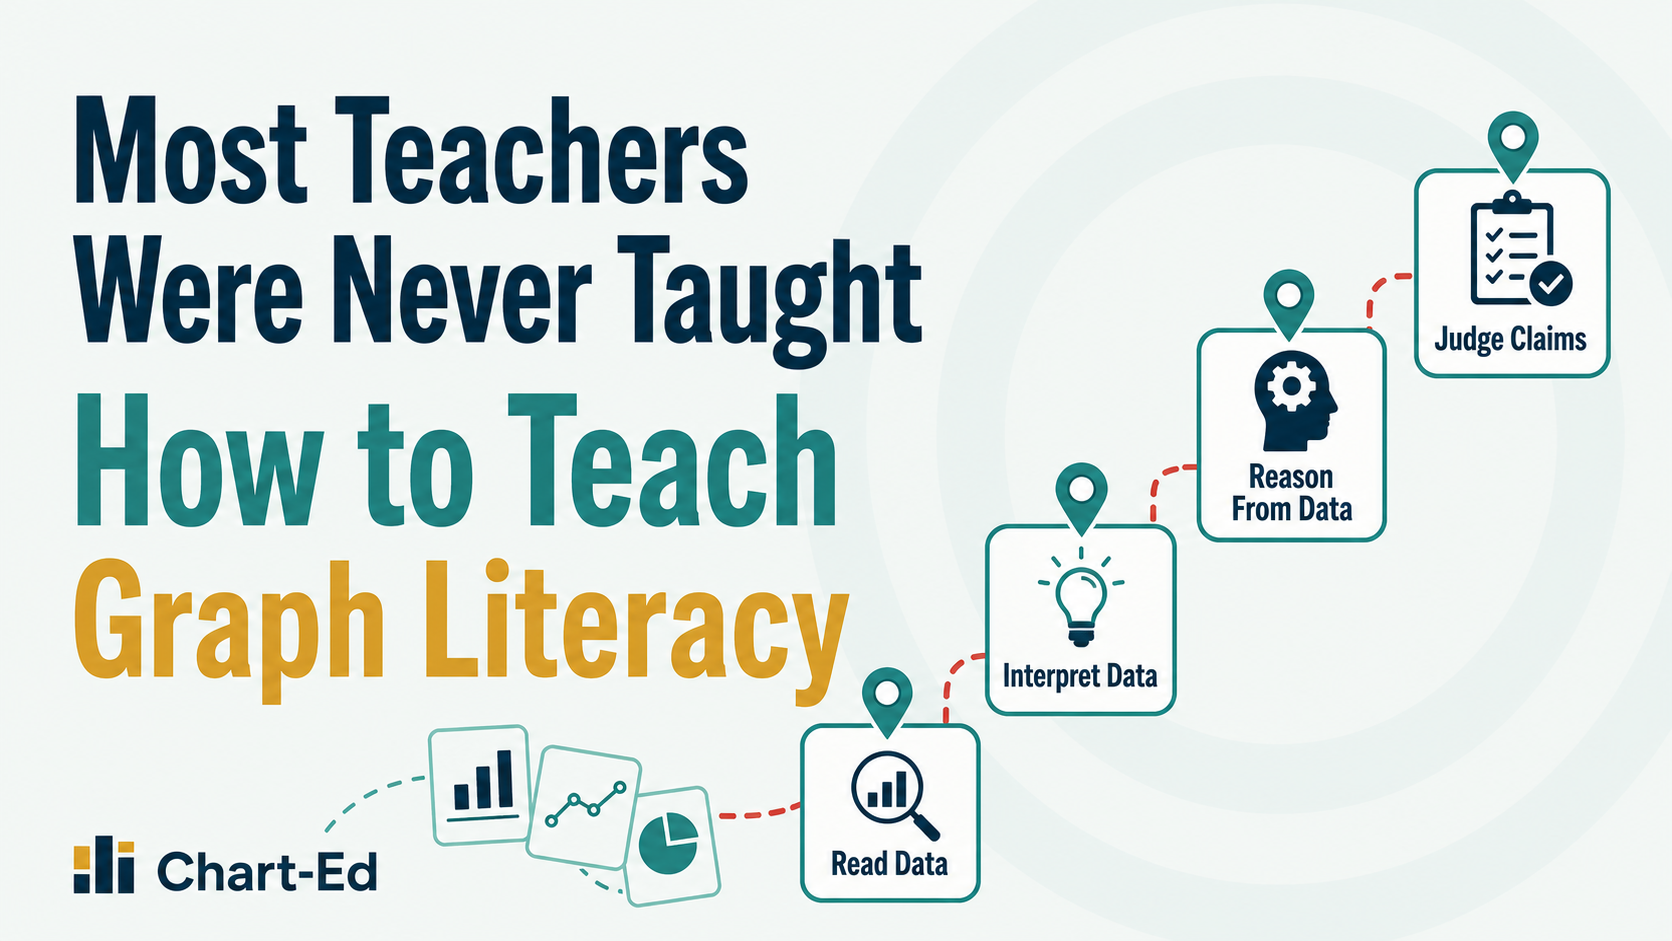
A Simple Roadmap
One practical way to organize graph literacy is through four moves:
Read Data
      ↓
Interpret Data
      ↓
Reason From Data
      ↓
Judge Claims From Data
This is not a rigid script.
It is a planning tool.
At the first level, students learn to locate information accurately.
At the second level, students compare values, notice patterns, and explain meaning.
At the third level, students connect evidence to conclusions.
At the fourth level, students evaluate whether a claim is actually supported by the chart.
That last move is where graph literacy becomes academic judgment.
What This Changes
With a roadmap, teachers can ask more precise questions.
Instead of only asking:
Can the student answer the graph question?
we can ask:
Can the student read the data?
Can the student interpret the data?
Can the student reason from the data?
Can the student judge whether a claim fits the data?
Those questions make instruction clearer.
They also make student difficulties easier to diagnose.
If a student cannot read the axis, they need a different kind of help than a student who reads the chart correctly but overstates what it proves.
If a student can find a value but cannot explain its meaning, they need interpretation practice.
If a student can identify a pattern but cannot support a conclusion, they need evidence-based reasoning practice.
The Teacher Move
The next time you plan a chart activity, do not start with the chart.
Start with the level of thinking you want students to practice.
Ask:
Am I asking students to read data?
Am I asking students to interpret data?
Am I asking students to reason from data?
Am I asking students to judge a claim from data?
Then choose or write questions that match that level.
That one move can make graph literacy instruction feel less random and more developmental.
Free Resource
Use the Graph Literacy Teaching Roadmap to plan chart instruction across four levels:
Read Data
Interpret Data
Reason From Data
Judge Claims From Data
Download the Graph Literacy Teaching Roadmap
Product Bridge
If you want classroom-ready resources that help students practice this progression across chart types and reasoning demands, explore Chart-Ed Teacher Editions and the Data Ascent collection.
Explore Chart-Ed Teacher Resources
Bibliography
- American Statistical Association. (2020). Pre-K-12 Guidelines for Assessment and Instruction in Statistics Education II: A Framework for Statistics and Data Science Education. American Statistical Association.
- Curcio, F. R. (1987). "Comprehension of Mathematical Relationships Expressed in Graphs." Journal for Research in Mathematics Education, 18(5), 382-393. https://doi.org/10.5951/jresematheduc.18.5.0382
- Friel, S. N., Curcio, F. R., and Bright, G. W. (2001). "Making Sense of Graphs: Critical Factors Influencing Comprehension and Instructional Implications." Journal for Research in Mathematics Education, 32(2), 124-158. https://doi.org/10.2307/749671
- Garfield, J. B., and Ben-Zvi, D. (2008). Developing Students' Statistical Reasoning: Connecting Research and Teaching Practice. Springer. https://doi.org/10.1007/978-1-4020-8383-9
- Shah, P., and Hoeffner, J. (2002). "Review of Graph Comprehension Research: Implications for Instruction." Educational Psychology Review, 14(1), 47-69. https://doi.org/10.1023/A:1013180410169