Turn Any Chart Into a Better Discussion Prompt
If your chart questions stop at “What do you notice?”, you’re leaving deeper thinking on the table. Small shifts in phrasing can move students from quick glances to evidence-based reasoning.
The Problem with Surface-Level Prompts
We’ve all used questions like:
- “What do you notice about this chart?”
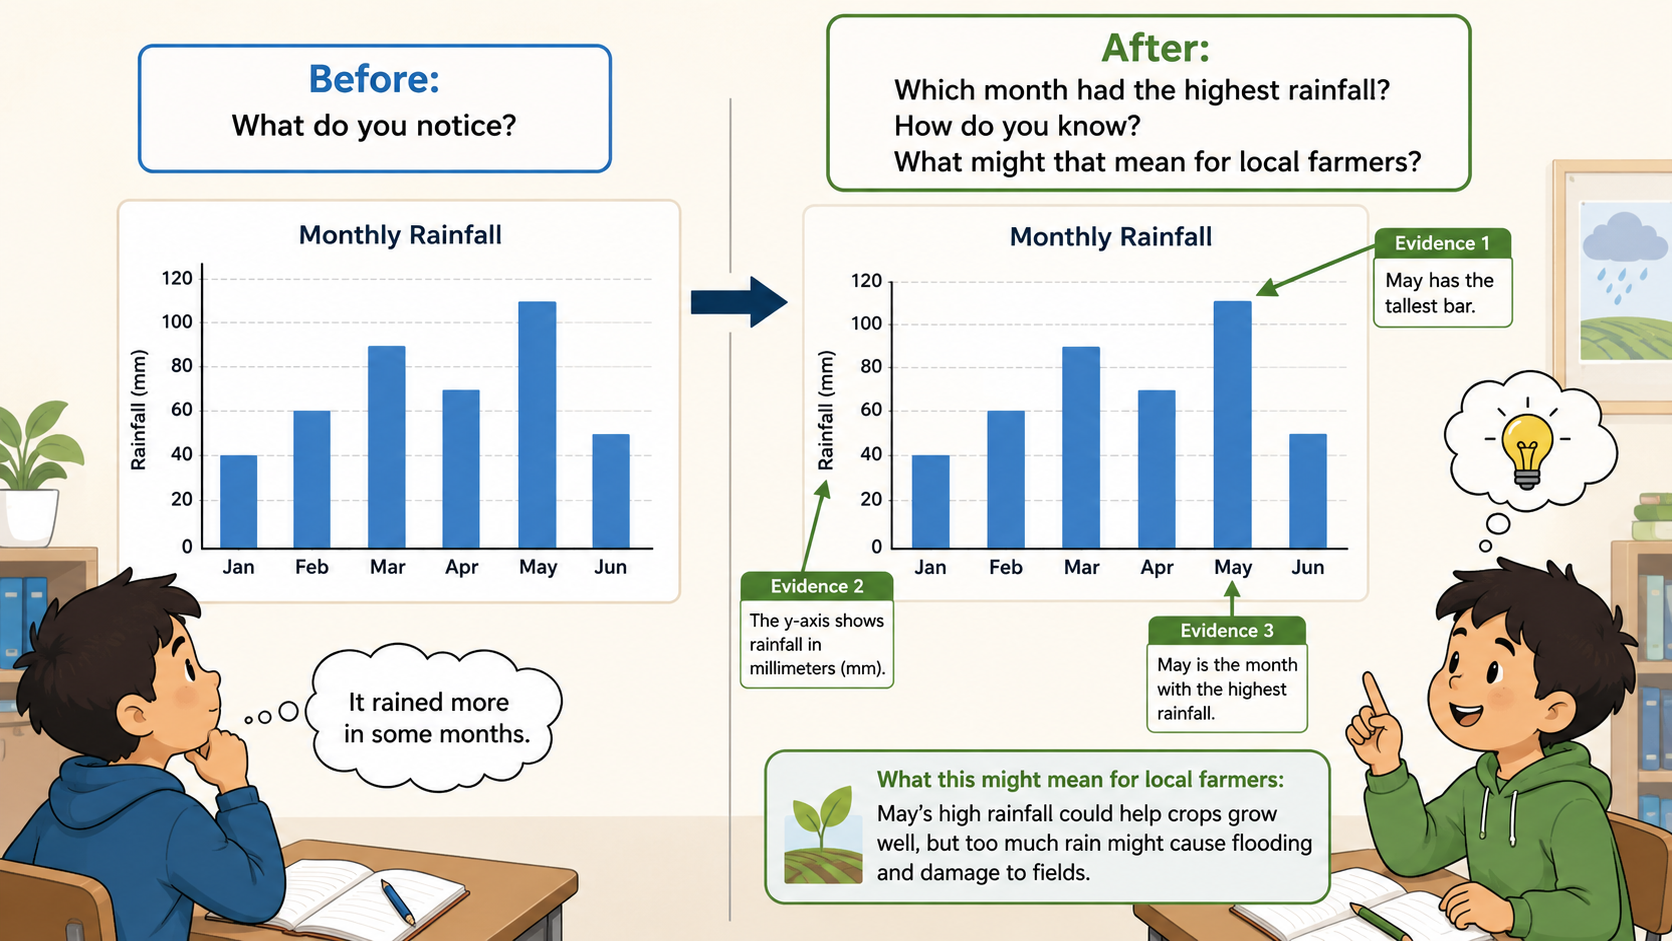
- “What does this data show?” But these open‑ended invitations often land flat. Students glance, pick out the most obvious feature, and move on. For example, show a bar chart of monthly rainfall and ask “What do you notice?” A typical answer: “It rained more in some months.” True—but not much thinking required. When prompts stop at “what,” the chart becomes a picture to label, not a source of evidence to reason with. To build a classroom culture of evidence, we need questions that push students to locate specific data, support claims with chart details, and consider what the patterns might mean.
A Simple Framework for Rebuilding Prompts
The shift is easier than you think. Try a three‑part structure:
- Focus on a specific data point or pattern.
- Ask for evidence from the chart (“How do you know?”).
- Require reasoning or a prediction (“So what? What might explain this? What’s uncertain?”).
Using the same rainfall bar chart, transform the shallow question into:
“Which month had the highest rainfall? How do you know? What might that mean for local farmers?”
Now students can’t just glance. They must scan the bars, compare lengths, cite the axis, and connect the data to a real‑world consequence. The question demands evidence and thinking, not just noticing.
Before and After: Real Classroom Examples
Try these prompt makeovers from different chart types:
Line graph – global temperature change over time Before: “What does this graph show?” After: “What trend do you observe between 1950 and 2020? What data points from the graph support your description? What factors might help explain this pattern, and what’s still uncertain?”
Pie chart – energy sources in a country Before: “What does the chart tell you?” After: “Which energy source accounts for the largest share? Where on the chart do you see that? If the country doubles its renewable energy in a decade, how would the pie chart likely change? What assumptions are you making?”
In each case, the “after” prompt moves students from one‑word answers to evidence‑backed claims and speculation grounded in the data. It’s exactly the kind of thinking that builds a classroom culture of evidence.
Making It Routine: Turn Any Chart into a Thinking Task
You don’t need to rewrite every question from scratch. Keep a short list of reusable stems nearby:
Reusable Prompt Stems
- “What’s the evidence for your claim on this chart?”
- “How would you test this trend with additional data?”
- “What’s missing or uncertain in this visualization?”
- “How might the pattern change if conditions changed? Justify your answer with evidence from the chart.” Tape them to your whiteboard, or hand out a one‑page cheat sheet. The approach works across subjects—science, social studies, math—and across grade levels. The only requirement is a chart and a willingness to push past the surface.
Where to Find Charts That Already Do the Heavy Lifting
You don’t have to start from zero. Chart‑Ed resources already embed this kind of thinking:
- Chart Bank – ready‑to‑use charts with built‑in discussion prompts that ask for evidence.
- Data Forensics – deep‑dive investigations that guide students through uncertainty and reasoning.
- Teacher Guides – strategies for sustaining evidence‑based discussions across your curriculum.
These resources aren’t magic; they just make it easier to turn data into arguments, not just answers.
Takeaway
Move your chart questions from “what” to “how do you know” and “so what.” Require evidence, invite uncertainty, and push for reasoning. Start with one chart this week—rewrite the prompt, and see what kind of thinking it unlocks. For more support, connect this move to Chart-Ed Teacher Guides and Chart Bank activities that model evidence-centered prompting from the first question.