Real-world charts
Sourced from government agencies, research organizations, and global data providers - the same kinds of charts students encounter on assessments and in the world.
Chart-Ed | Data Math
Math
Chart-grounded math with justification
DLL 3-6
Calculation and justification tasks that require students to extract chart values before they compute, then cite the evidence that authorizes the answer.
Audience
Math teachers
Format
PDF student + teacher pack
Price
$10.99
Why it exists
When students encounter math on state assessments, the numbers rarely appear in a table or a word problem alone. They live inside grouped bar charts, comparison dashboards, and multi-variable graphs. Students are expected to identify the right values, compute accurately, and express their answers in precise, chart-bounded language - all in one move. Most math curricula do not teach this. Data Math does.
Real-world charts
Sourced from government agencies, research organizations, and global data providers - the same kinds of charts students encounter on assessments and in the world.
Student-facing tasks
Structured prompts that require students to read chart values first, then calculate, then justify - in that order, every time.
Teacher resource
A full instructional companion. A question-by-question coaching manual that tells you what to look for, what to reject, and how to redirect.
What's in the pack
The chart
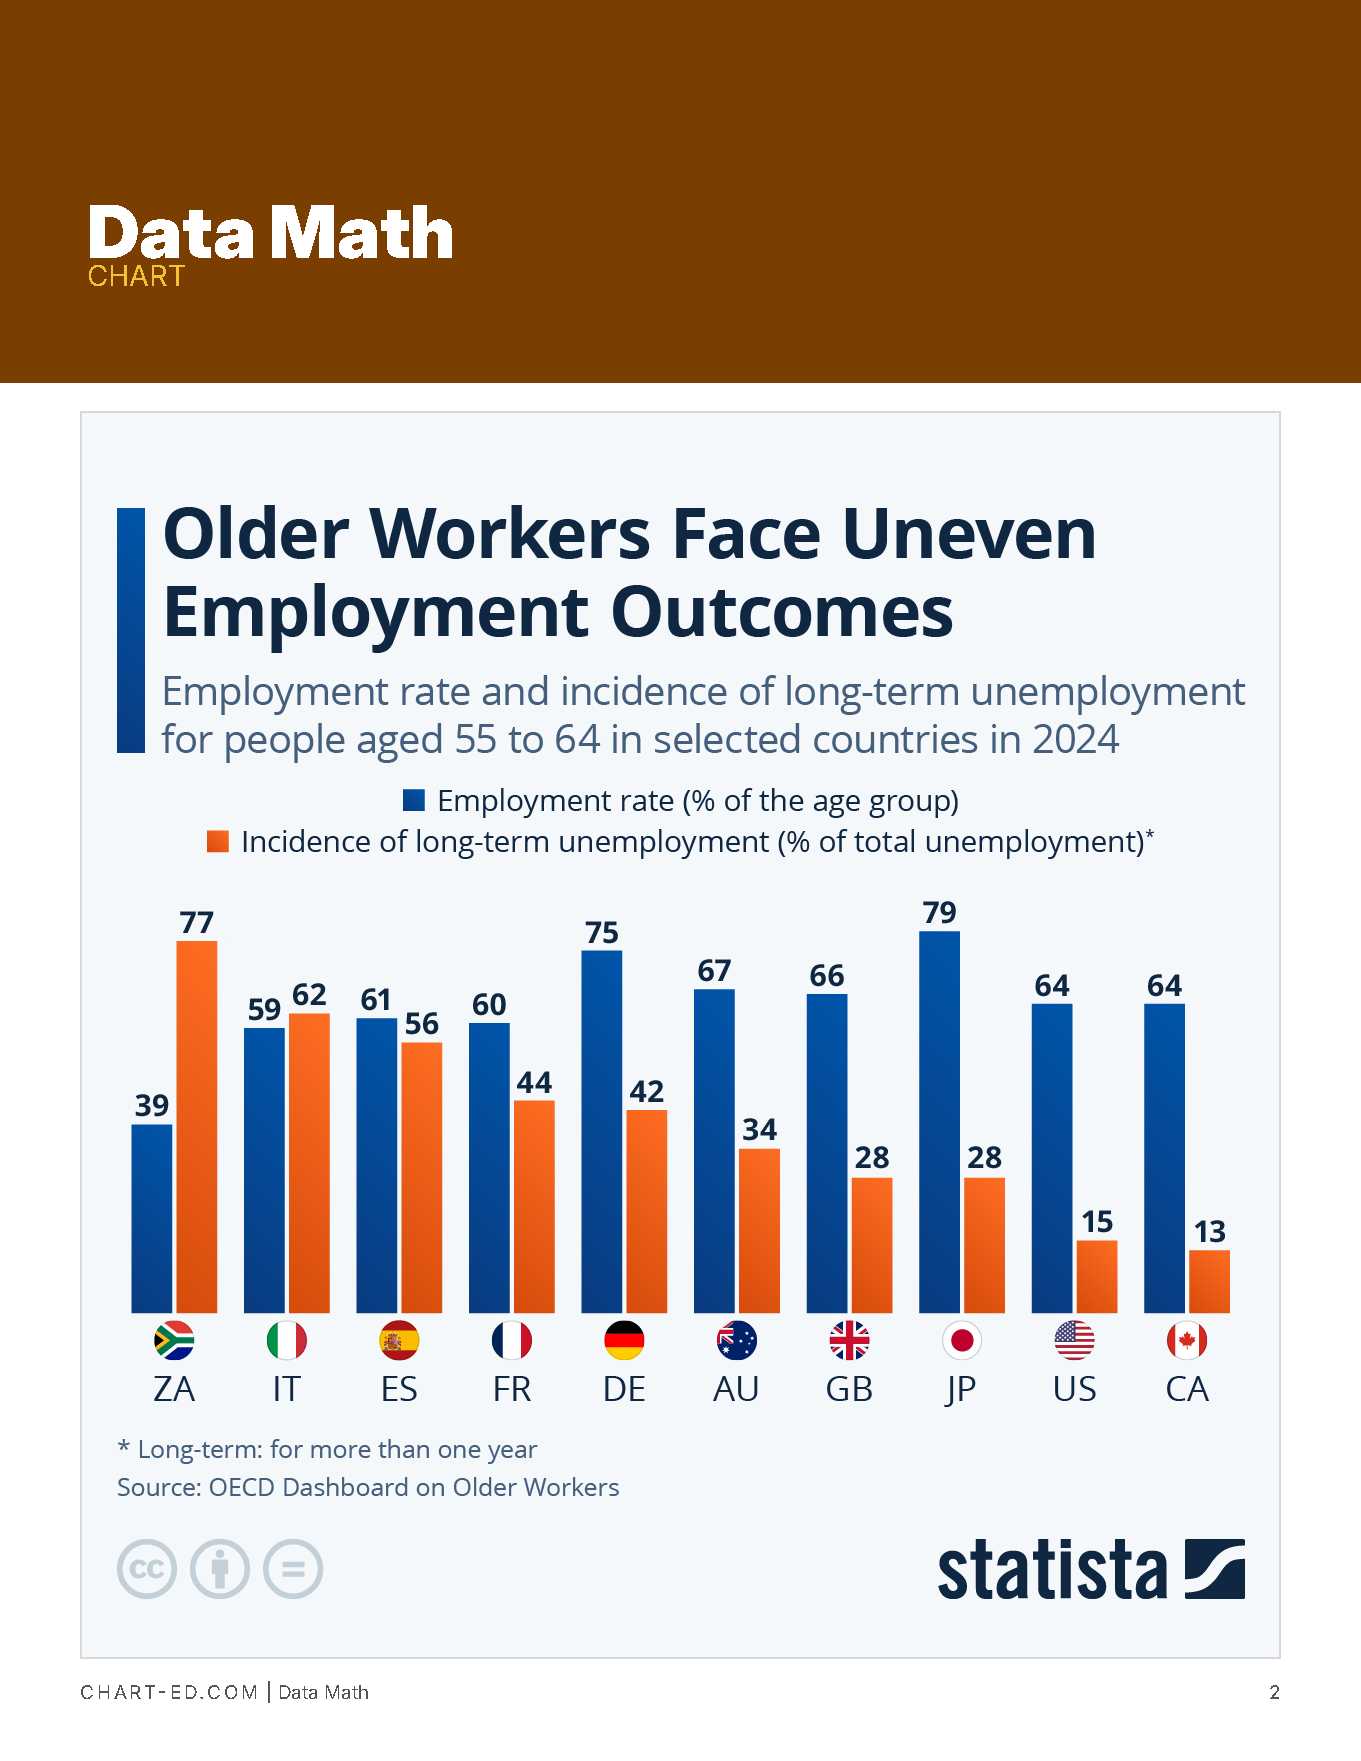
Each Data Math pack centers on a single, published chart - the kind produced by government agencies, research institutions, and global data organizations. The chart appears on its own page, printed large and uncluttered, so students can read it without competing distractions.
No manufactured data. No simplified school-edition graphs. The chart is real, the values are real, and the work students do with it is the same work they will face when data appears on an assessment or in the world.
Grades 6-8 · Grouped bar chart · Real-world source
Student pages
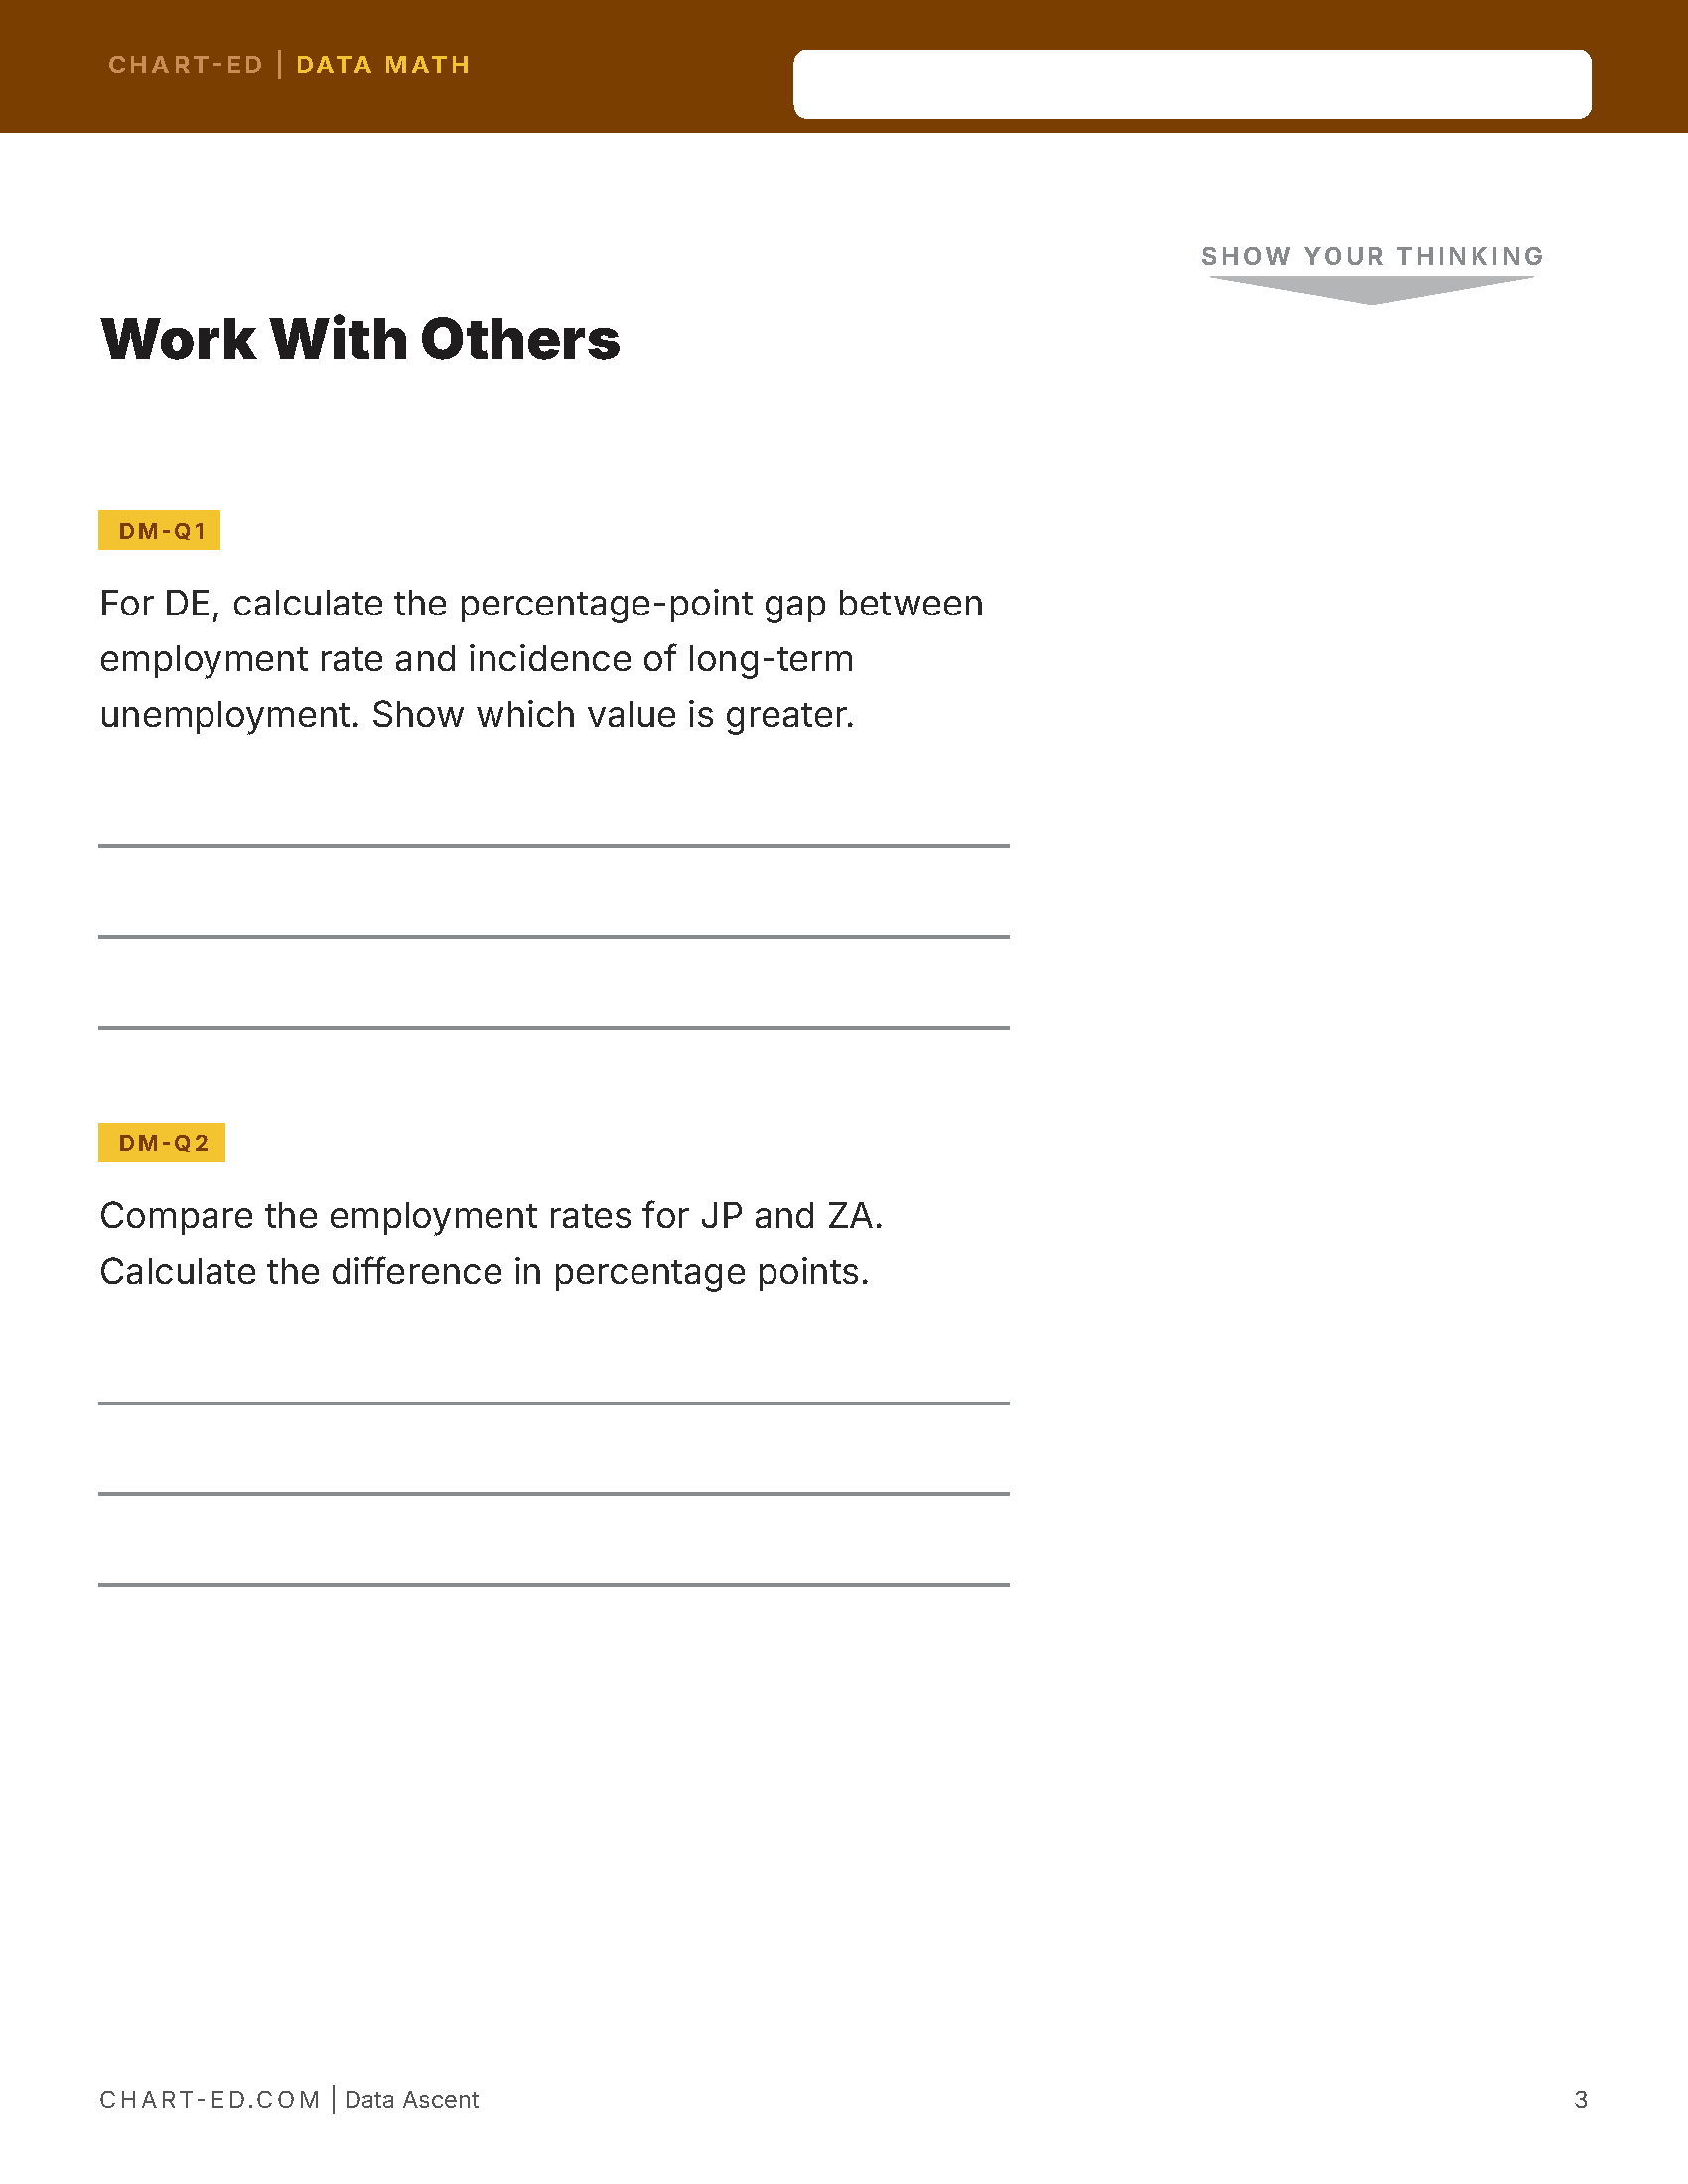
Students do not begin calculating until they have extracted the right values from the chart. That is the rule - and it is built into every task.
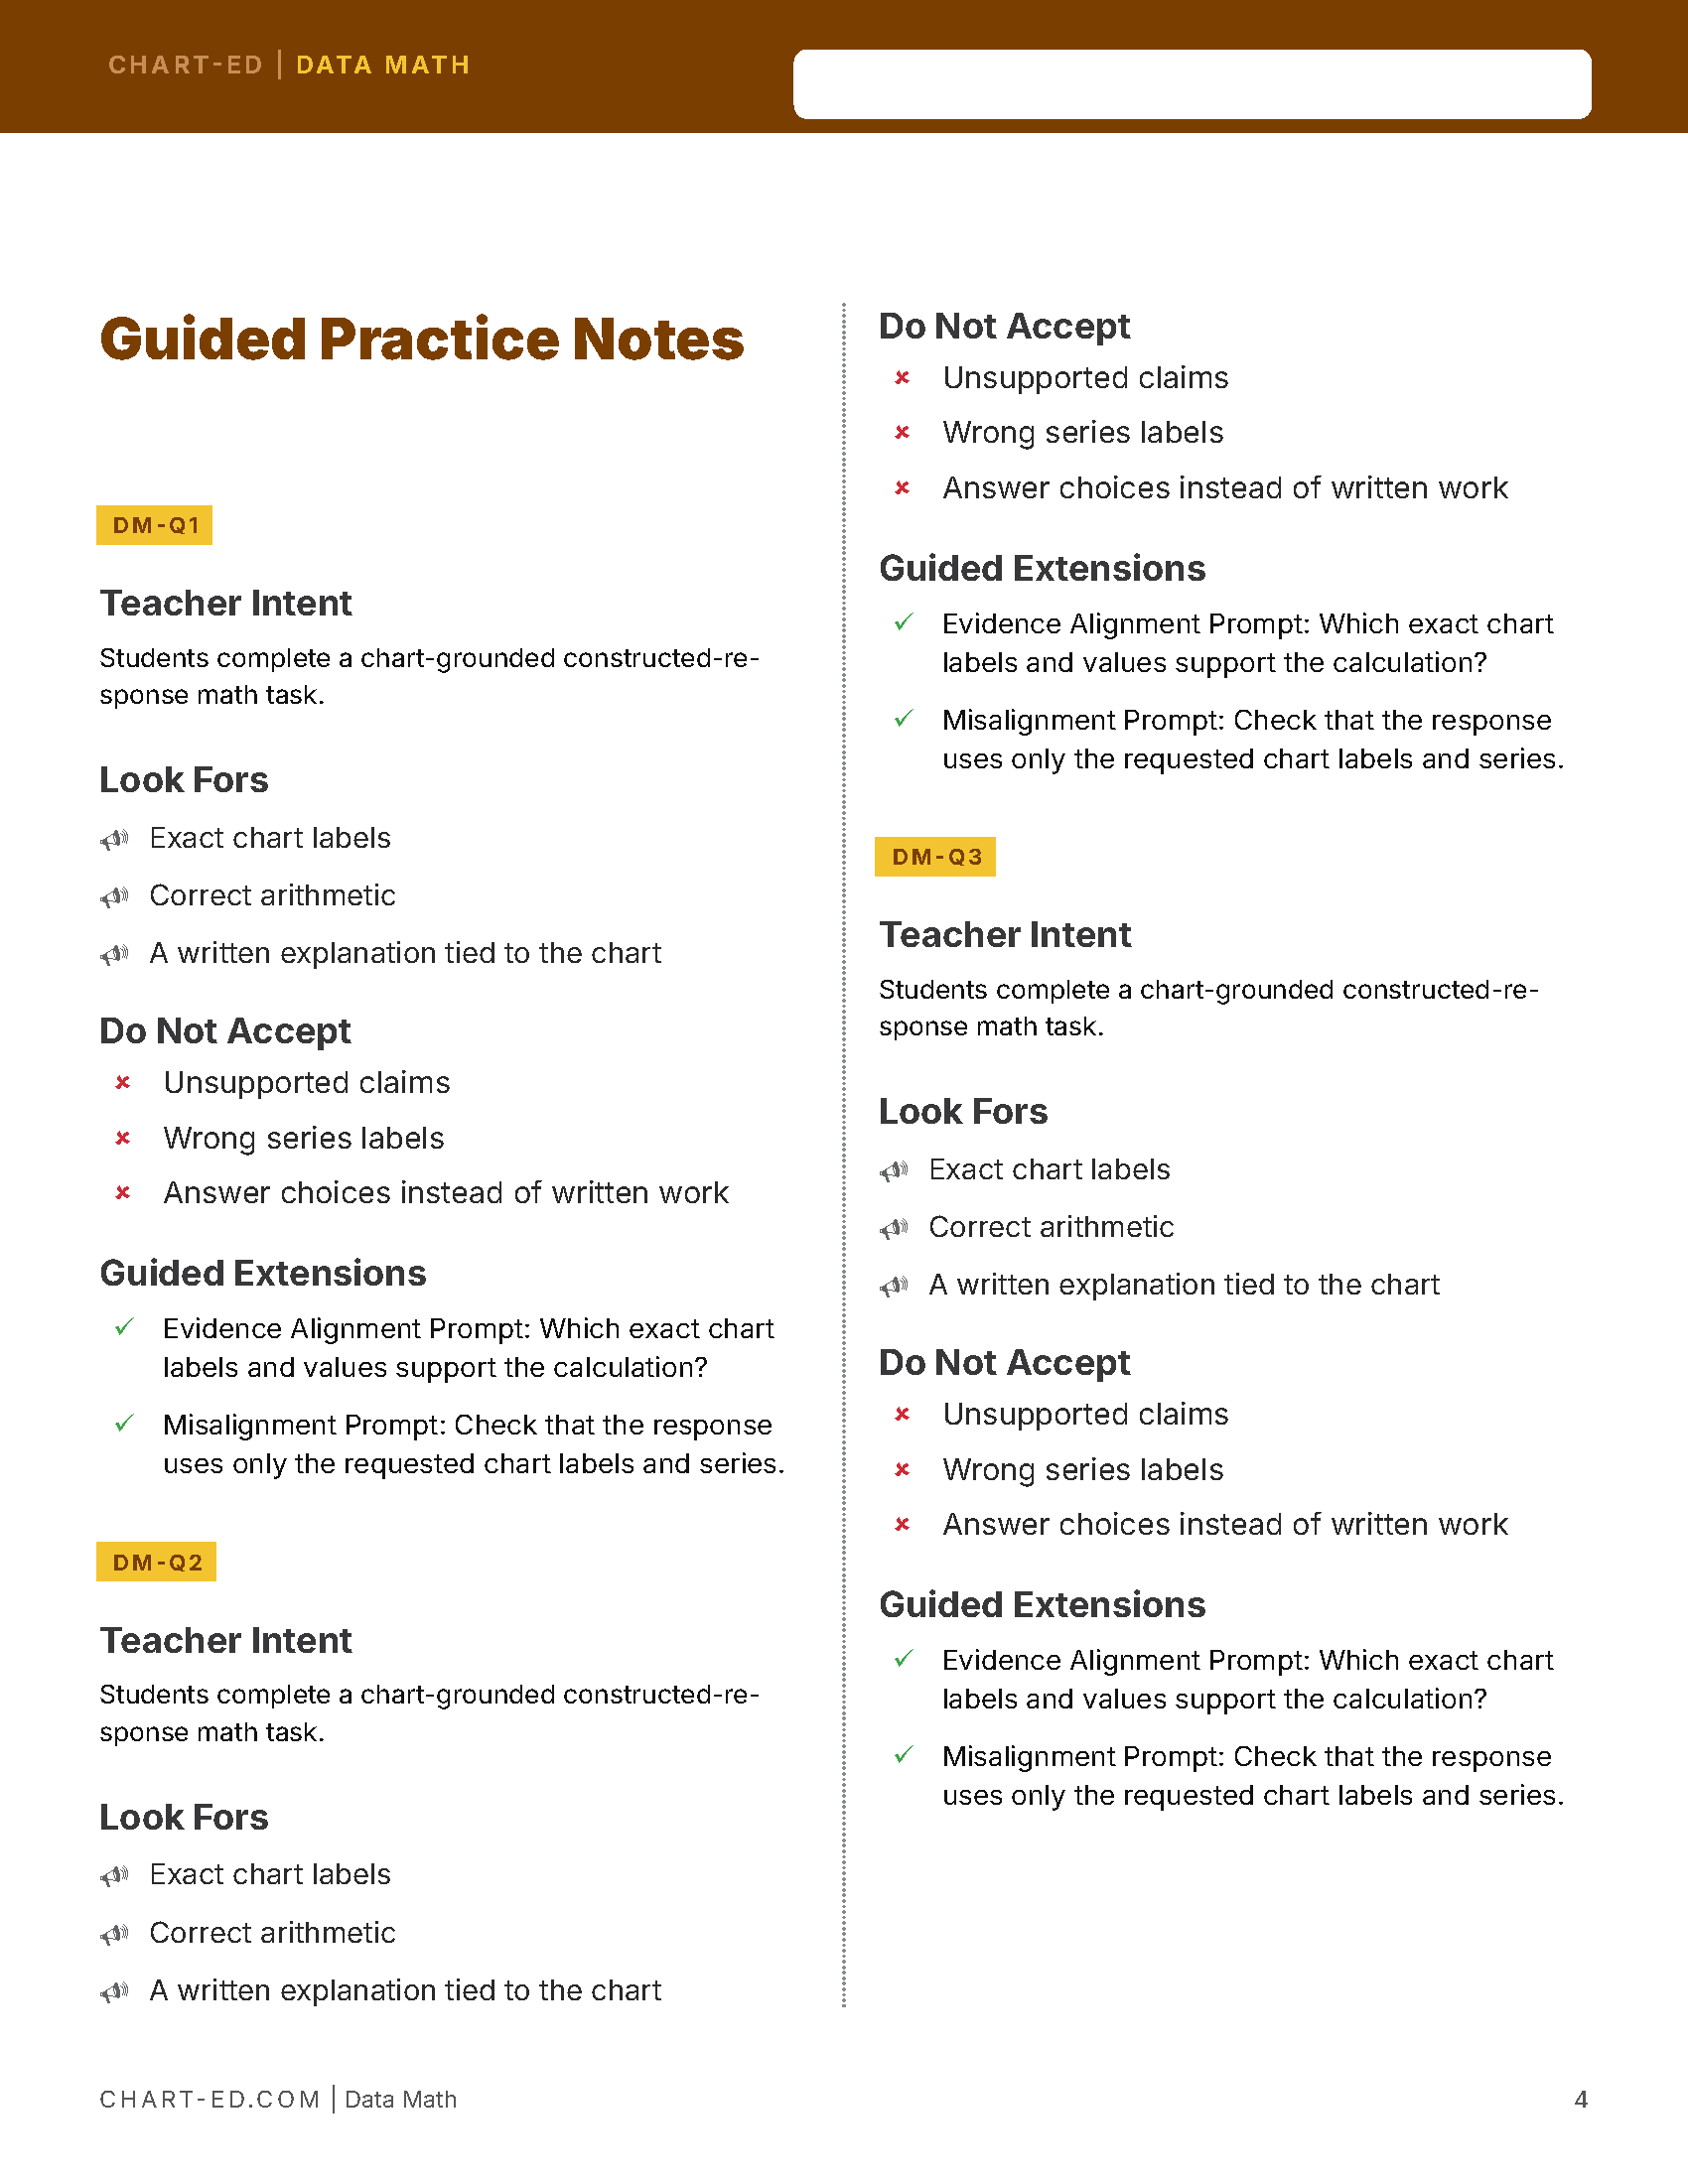
Guided Practice
DM-Q1 through DM-Q3 are completed collaboratively, with discussion built in.
Independent Practice
DM-Q4 through DM-Q6 use the same structure with less scaffolding.
Each task is coded so teacher notes, scoring guides, and student responses all speak the same language across the pack.
Teacher Edition
The Teacher Edition is not an answer key. It is a question-by-question coaching manual written to help you teach with precision - before student responses exist, while you are facilitating, and after you are reviewing work.
Teacher Intent: One sentence naming exactly what reasoning skill the question is building.
Look Fors: Specific values, comparisons, and language moves that signal a student is working correctly.
Do Not Accept: Exact wrong answers and error patterns to watch for, named specifically.
Guided Extensions: Two redirect prompts per question, ready to use in the moment.
Governance page
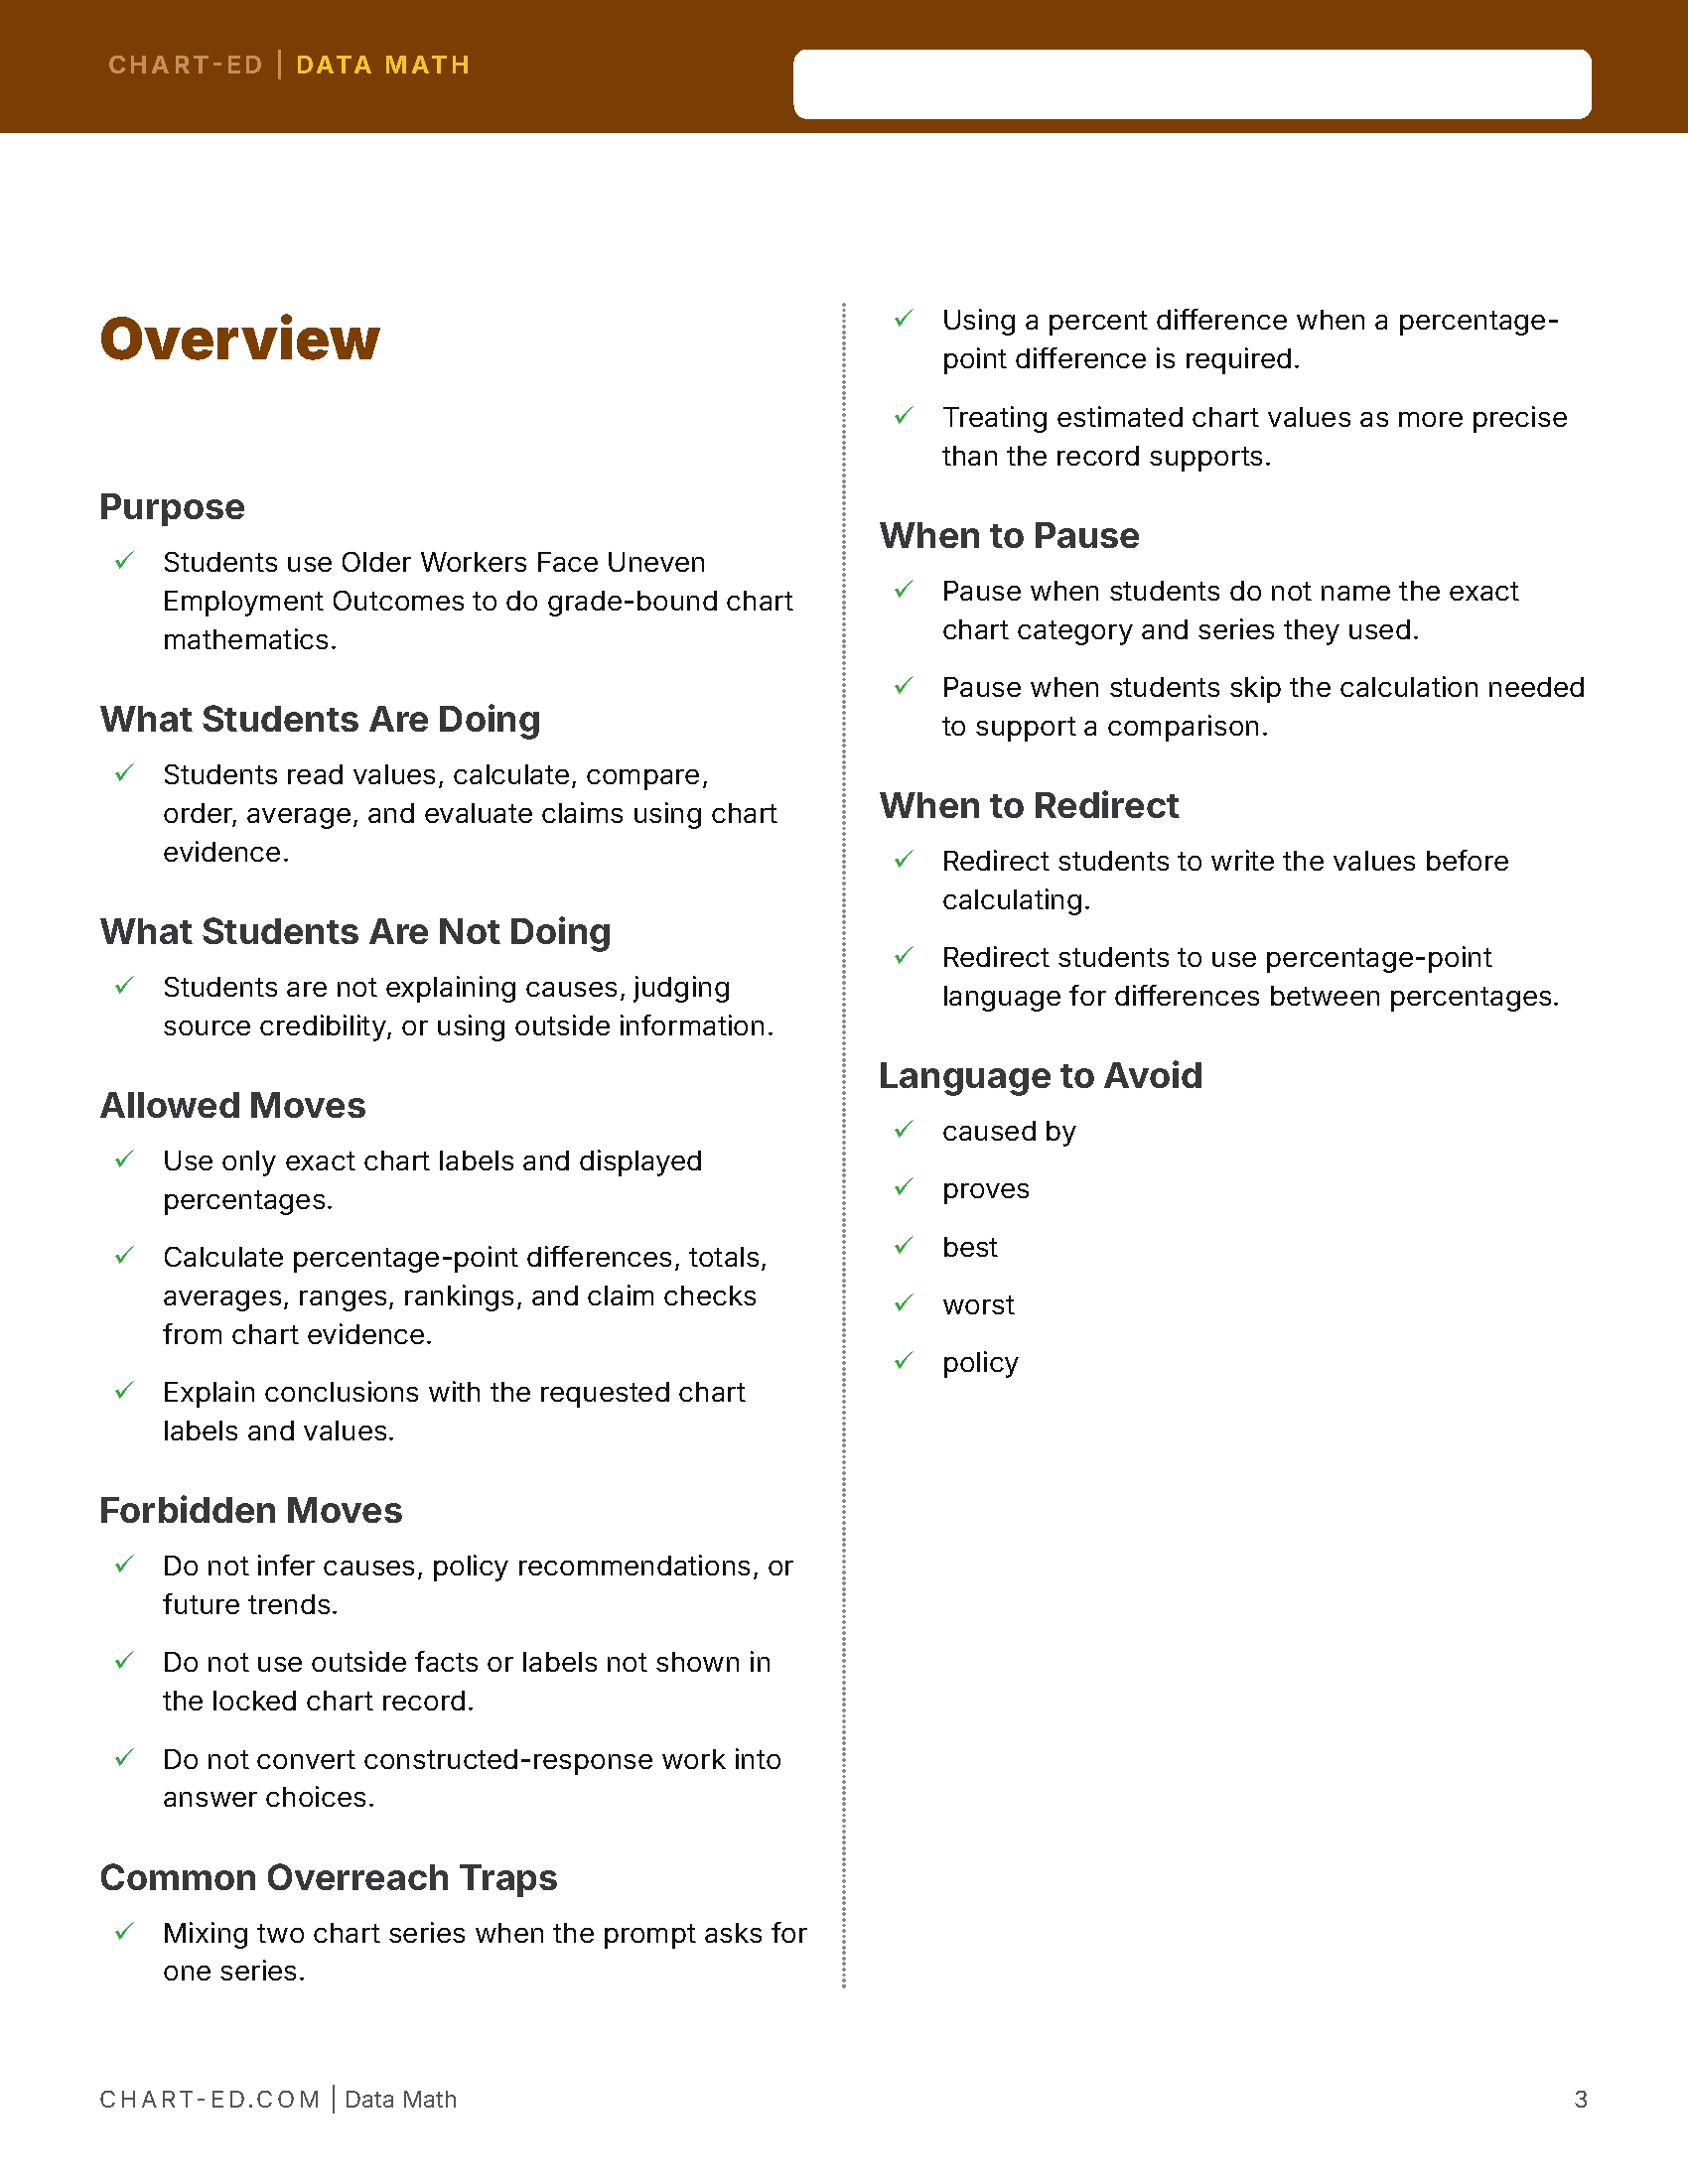
An opening overview that defines purpose, scope, Allowed Moves, Forbidden Moves, Common Overreach Traps, language to avoid, and redirect protocols.
Teacher intent per question
Every question carries a one-sentence statement of what reasoning skill it is developing, so you know what you're actually teaching.
Specific look fors
Exact expected values, comparisons, and language moves for each question. You know precisely what a strong response looks like before students turn in their work.
Do not accept, by name
Specific wrong answers and misconceptions are flagged per question, including errors like confusing percent change with percentage points.
Two redirect prompts ready
A Misalignment Prompt and an Evidence Alignment Prompt per question, written for the moment when a student goes off-track.
Answer key with computation chain
The full calculation pathway behind every answer, plus structured Accept and Do Not Accept scoring criteria.
"Most math resources stop at the answer. Data Math requires students to show where the answer came from - in the chart."
State assessments regularly present math problems embedded inside charts. Students are expected to locate specific values, compute differences or totals, and express findings in language that stays within the chart's evidence.
The gap is knowing which values to use, how to express precision appropriately, and how to justify an answer using visible chart evidence rather than inference.
Not
A set of math problems illustrated with a graph
It is
Tasks that cannot be completed without reading the chart first
Not
An answer key
It is
A question-by-question coaching manual with intent, look-fors, misconceptions, and redirect language
Not
Generic practice
It is
DLS-governed instruction aligned to where chart-based math appears on assessments
$10.99
Complete pack. One chart. One classroom-ready unit.
Grade-level specificity
Data Math packs come in grade-band variants matched to the complexity of the chart and the math operations required. The grade band appears on every pack cover and in the carousel below. Buy the pack that fits your class.
Product carousel
Choose a chart, then scroll across available grade-band variants.
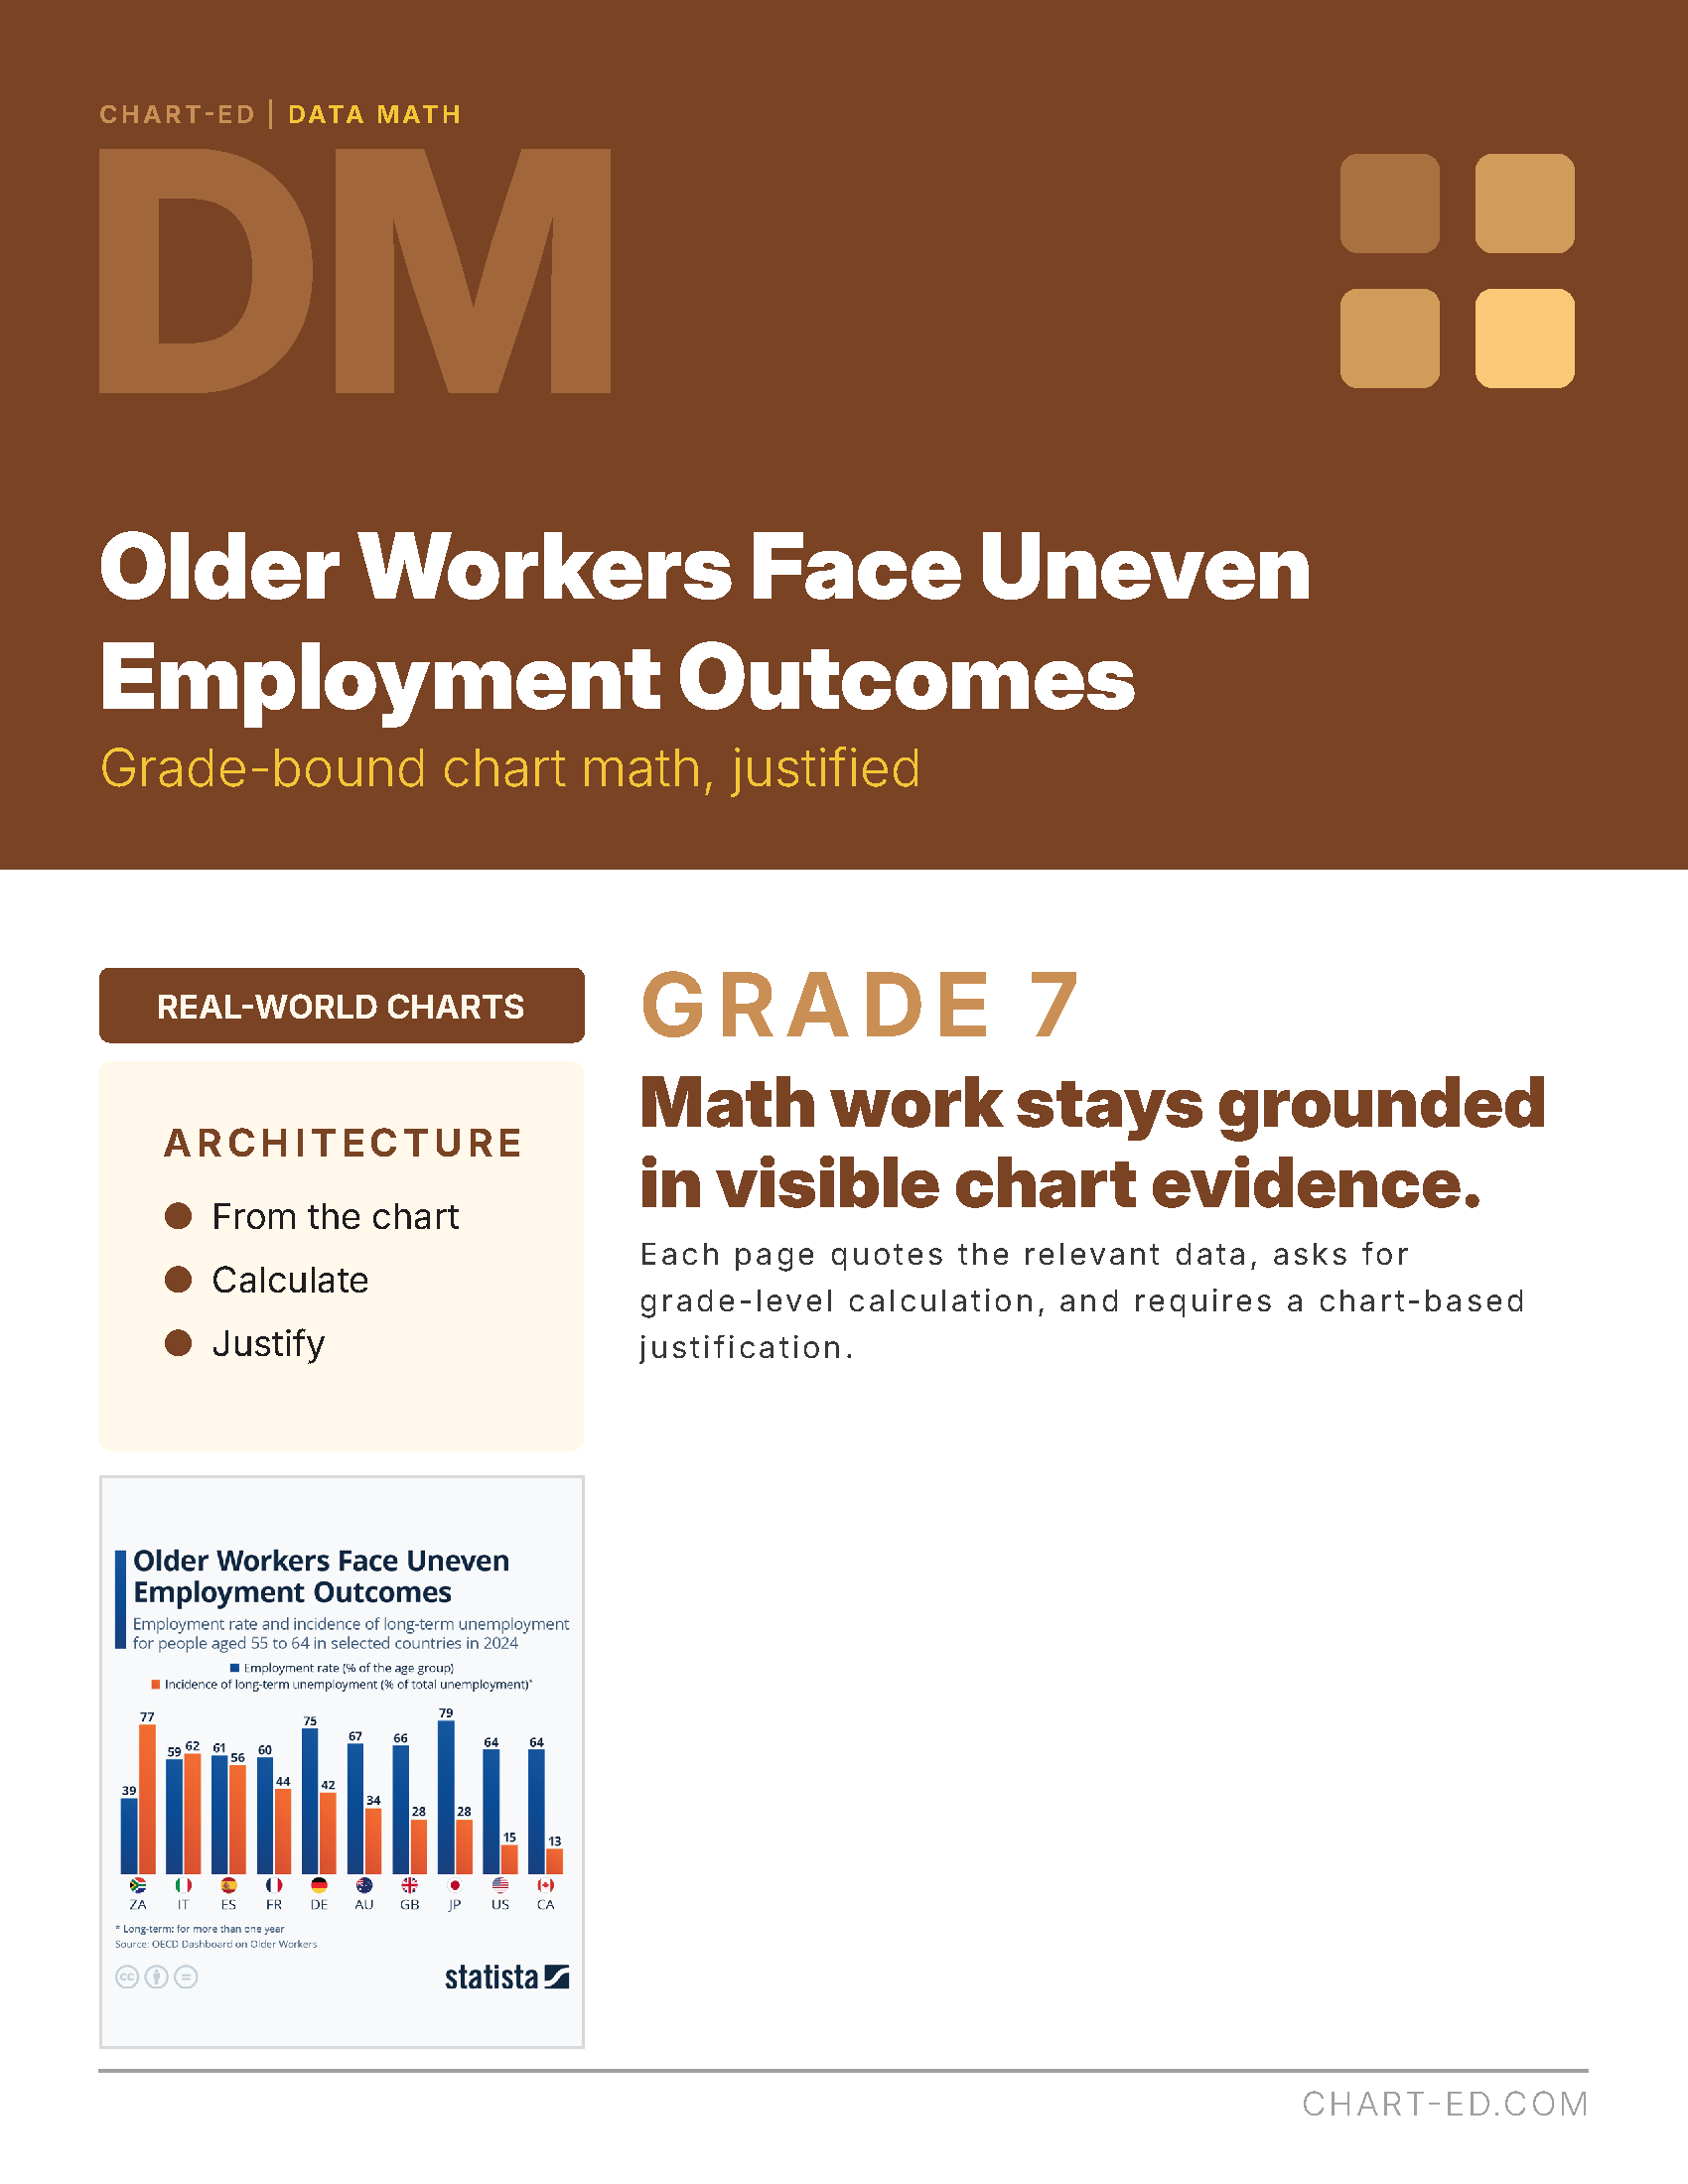
Data Math
Grade-bound math tasks where students calculate from visible chart evidence and justify how the chart supports the answer.
Browse all Data Math packs in the store, or use the Chart Generator to find a real-world chart that fits your current unit.
The Graph Literacy Brief
Teaching Guides, classroom moves, and free resources for helping students reason with evidence.
You will receive Chart-Ed articles, classroom moves, free resources, and product updates. Unsubscribe anytime. Privacy Policy.