Teacher Pain
Students notice a pattern in a chart but stop before interpreting what the pattern means.
They say:
The line goes up.
That answer is not wrong. It is just unfinished.
The classroom problem is that students often stop at observation when the task requires interpretation.
What Is Really Happening
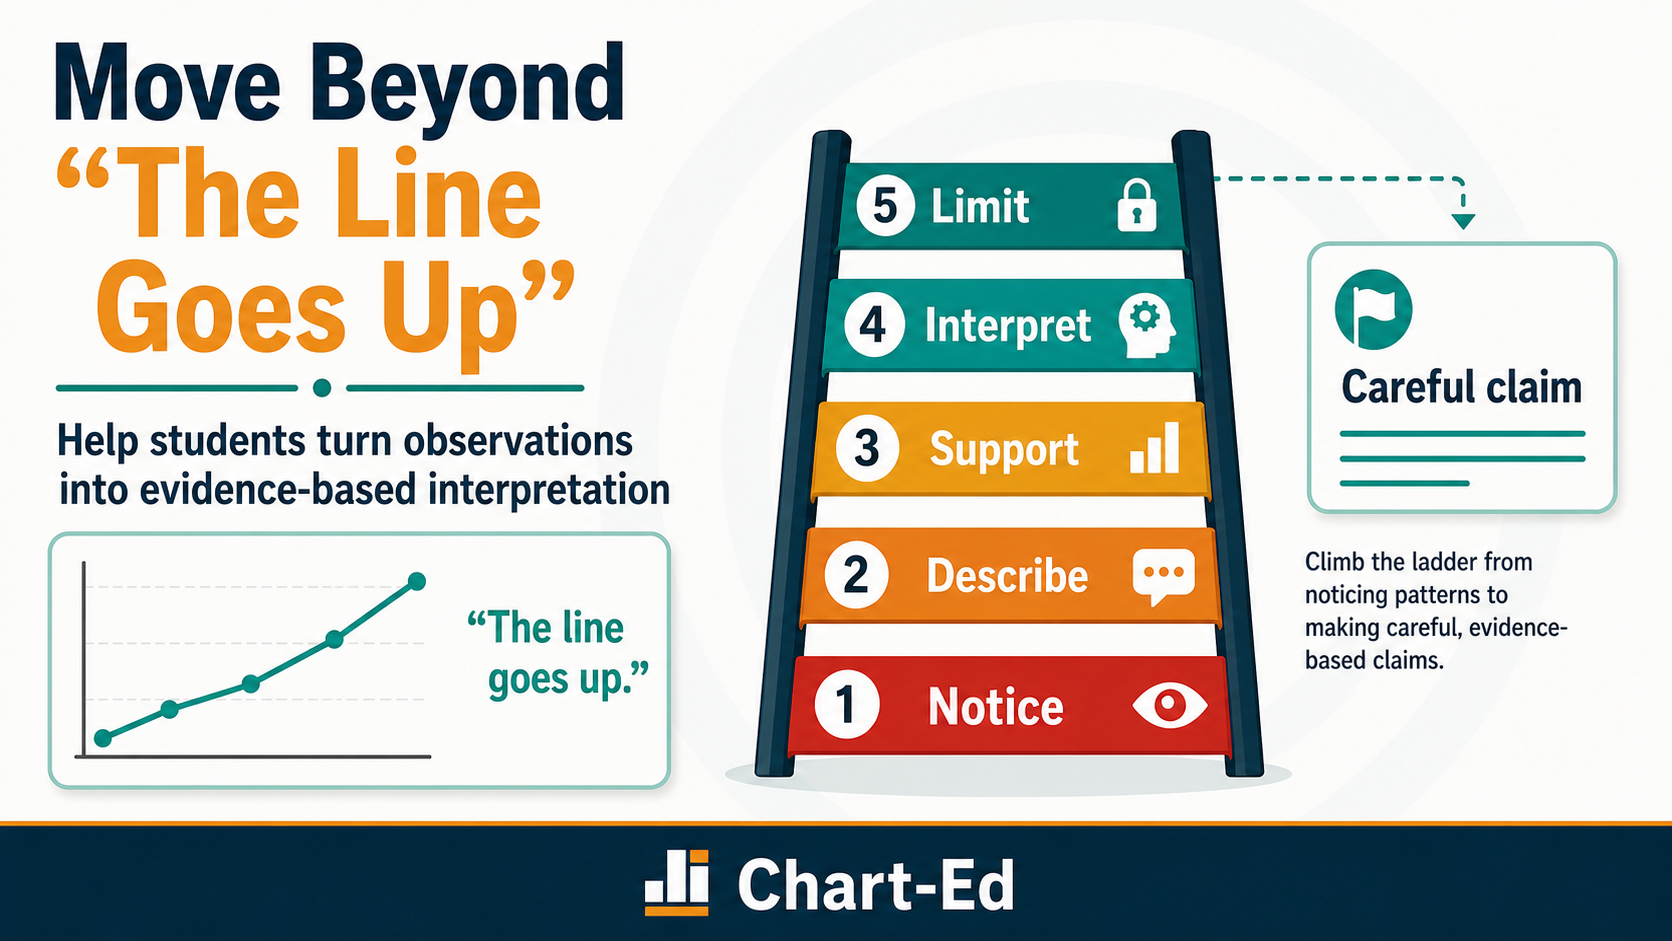
Students are standing on the first rung of the reasoning ladder.
They can notice direction, size, or change. But they have not yet explained:
What evidence shows the pattern?
What conclusion is supported?
What does the chart not explain?
The reasoning problem is this:
Observation is being treated as interpretation.
Chart-Ed treats this as a movement problem: students need to move from noticing to describing, supporting, interpreting, and limiting.
Classroom Move
When a student says:
The line goes up.
Respond with:
Good. What does that help us understand?
Then ask:
What evidence shows the increase?
How much did it change?
What conclusion can we make from that pattern?
What can we not explain from this chart alone?
Example
Imagine a line graph showing monthly rainfall.
Student response:
The line goes up from January to July.
Use the ladder:
Notice: The line goes up.
Describe: Rainfall increases from January to July.
Support: January is around 20 millimeters, and July is around 80 millimeters.
Interpret: The chart supports the claim that rainfall was higher in summer months.
Limit: The chart does not explain why rainfall increased.
Now the student has moved from reading the line to reasoning from the line.
How To Use The Free Resource
Use the From Noticing to Reasoning Ladder whenever students identify a pattern too quickly or too generally.
The ladder prompts students through five moves:
Notice
Describe
Support
Interpret
Limit
This works especially well for line graphs, bar charts, scatter plots, trend questions, assessment review, science data discussions, and social studies charts.
Common Mistake To Watch For
Do not skip the evidence step.
Students may move from:
The line goes up.
directly to:
That means the program worked.
The ladder requires them to show the pattern before interpreting it.
Free Resource
Download the From Noticing To Reasoning Ladder
Product Bridge
Use Chart-Ed Data Ascent for structured practice moving students from reading values to interpreting patterns and defending conclusions with evidence.