You just finished a chart-based lesson.
Students participated. They wrote something down. The activity is complete.
But can they actually use evidence?
That is the question a better exit ticket should answer.
Why Many Exit Tickets Miss the Point
Standard exit tickets often ask students to recall a fact, define a term, or rate how they feel about the lesson.
Those can be useful.
But when students are working with charts and data, teachers need a different kind of signal.
You need to know whether students can:
- pull specific evidence from a visualization
- recognize uncertainty or missing information
- ask a next question worth investigating
Completion is not enough.
The exit ticket should reveal evidence-based thinking.
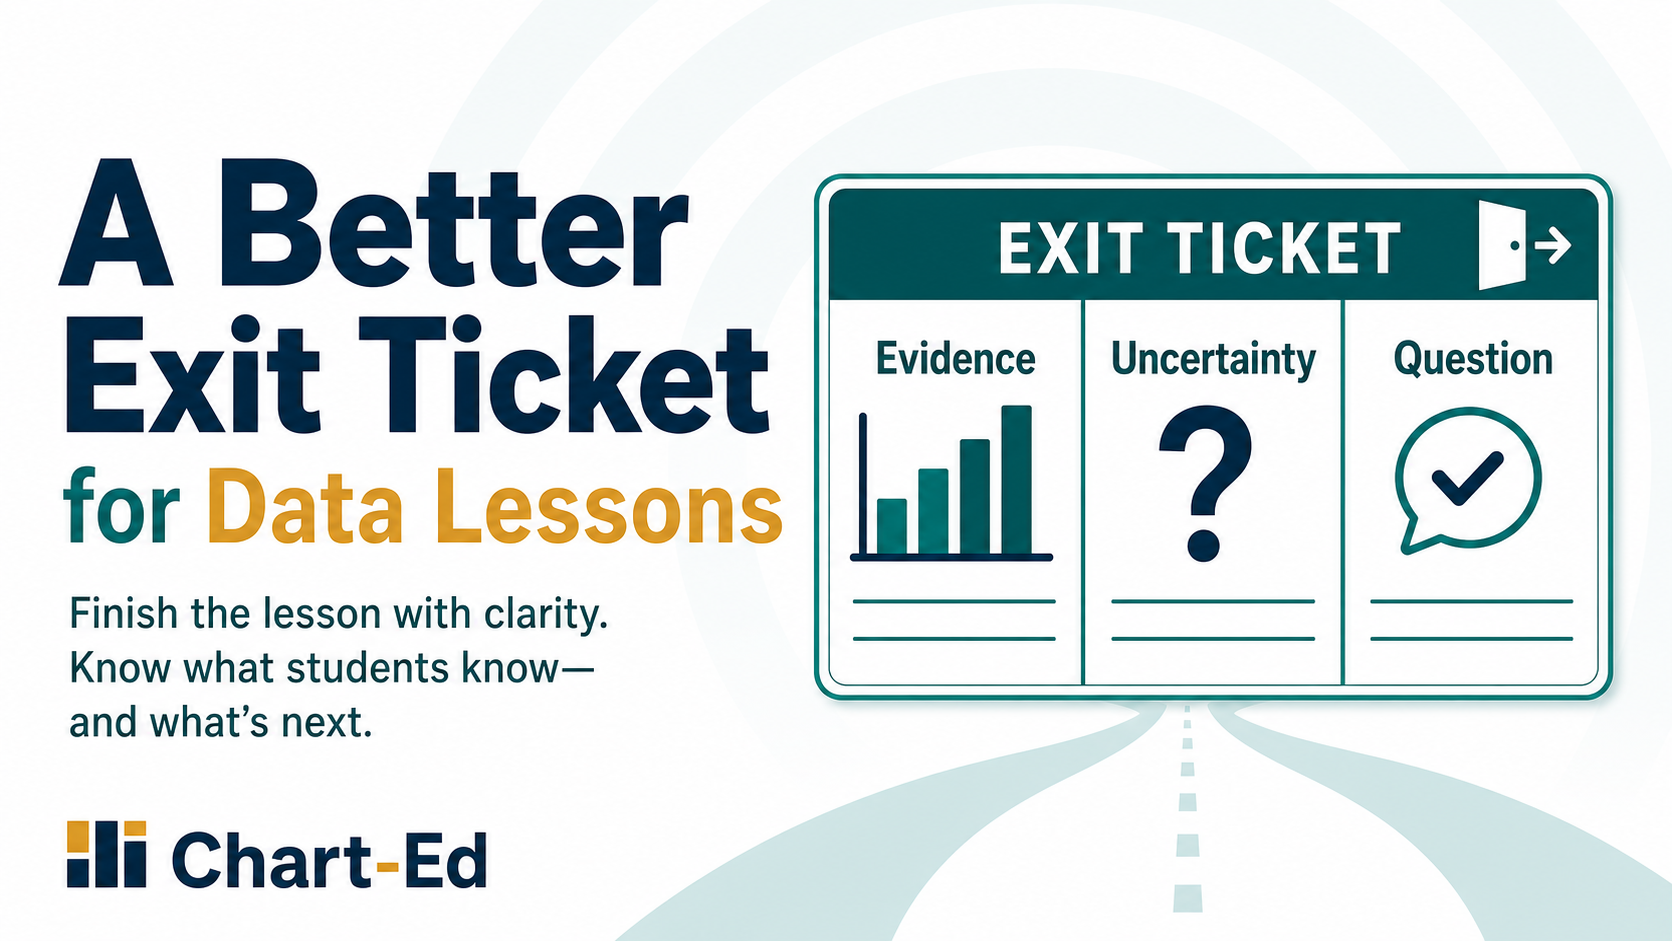
The EUQ Exit Ticket
Give students three prompts:
Evidence
What is one piece of evidence from the chart?

Uncertainty
What is unclear or uncertain about the data?

Question
What is one question you would ask next?
That is it.
No multiple choice. No long essay. No elaborate worksheet.
Just evidence, uncertainty, and a question.
Why These Three Prompts Work Together
Evidence
This prompt shows whether students can locate something specific in the chart.
It separates precise evidence from vague comments like:
It went up.
This one is bigger.
The graph says more.
Uncertainty
This prompt teaches students that good reasoning includes limits.
Students learn to ask:
What does this chart not show?
What information is missing?
What should I be careful about assuming?
Question
This prompt turns interpretation into inquiry.
Instead of treating a chart as the end of thinking, students learn to see it as the beginning of investigation.
How to Use It Tomorrow
Use the EUQ ticket during the last five minutes of a chart-based lesson.
Ask students to respond to one chart using all three prompts.
Then scan the responses for patterns:
- Are students naming evidence precisely?
- Are they noticing uncertainty?
- Are their questions connected to the data?
Do not grade every response.
Use the responses as a next-day discussion starter.
What You Might Learn
A strong response might look like:
Evidence:
The bar for online purchases is about twice as tall as the bar for store purchases.

Uncertainty:
We do not know how many people were surveyed.

Question:
Would the results be different for older adults?
That kind of response tells you more than whether a student remembered the topic.
It tells you how the student is beginning to reason from data.
Free Resource
Download the Evidence-Uncertainty-Question Exit Ticket
Use it after chart lessons, data discussions, science investigations, social studies document work, math data tasks, or informational text lessons with graphs.
Product Bridge
If you want structured practice helping students move from chart evidence to stronger data reasoning, connect this routine with Chart-Ed Data Forensics, Data Ascent, and teacher implementation resources.