Why Most Data Lessons Skip the Hard Part
The Chart That Started a Conversation
Imagine a middle school classroom at the start of a data unit. The teacher projects a simple bar chart showing monthly rainfall over a year. The question on the screen reads: "Which month had the most rain?" Hands shoot up. "December," a student answers confidently. The teacher nods. Quick, clean, and correct.
Then the teacher asks a follow-up: "Based on this, would you schedule the school's outdoor field day in July? Explain your reasoning." The room quiets. The same student stares at the chart, then back at the teacher. "I don't know—it shows data, but it doesn't say what to do."
This moment captures a gap that runs through many data literacy lessons: students are taught to read charts, but rarely to reason from them. And yet, the ability to move from extracting values to making evidence-based decisions is the whole point of data literacy in the real world.
What Most Data Lessons Actually Teach
Open a typical math or science workbook, or browse released assessment items, and you'll see a pattern. Data tasks often focus on:
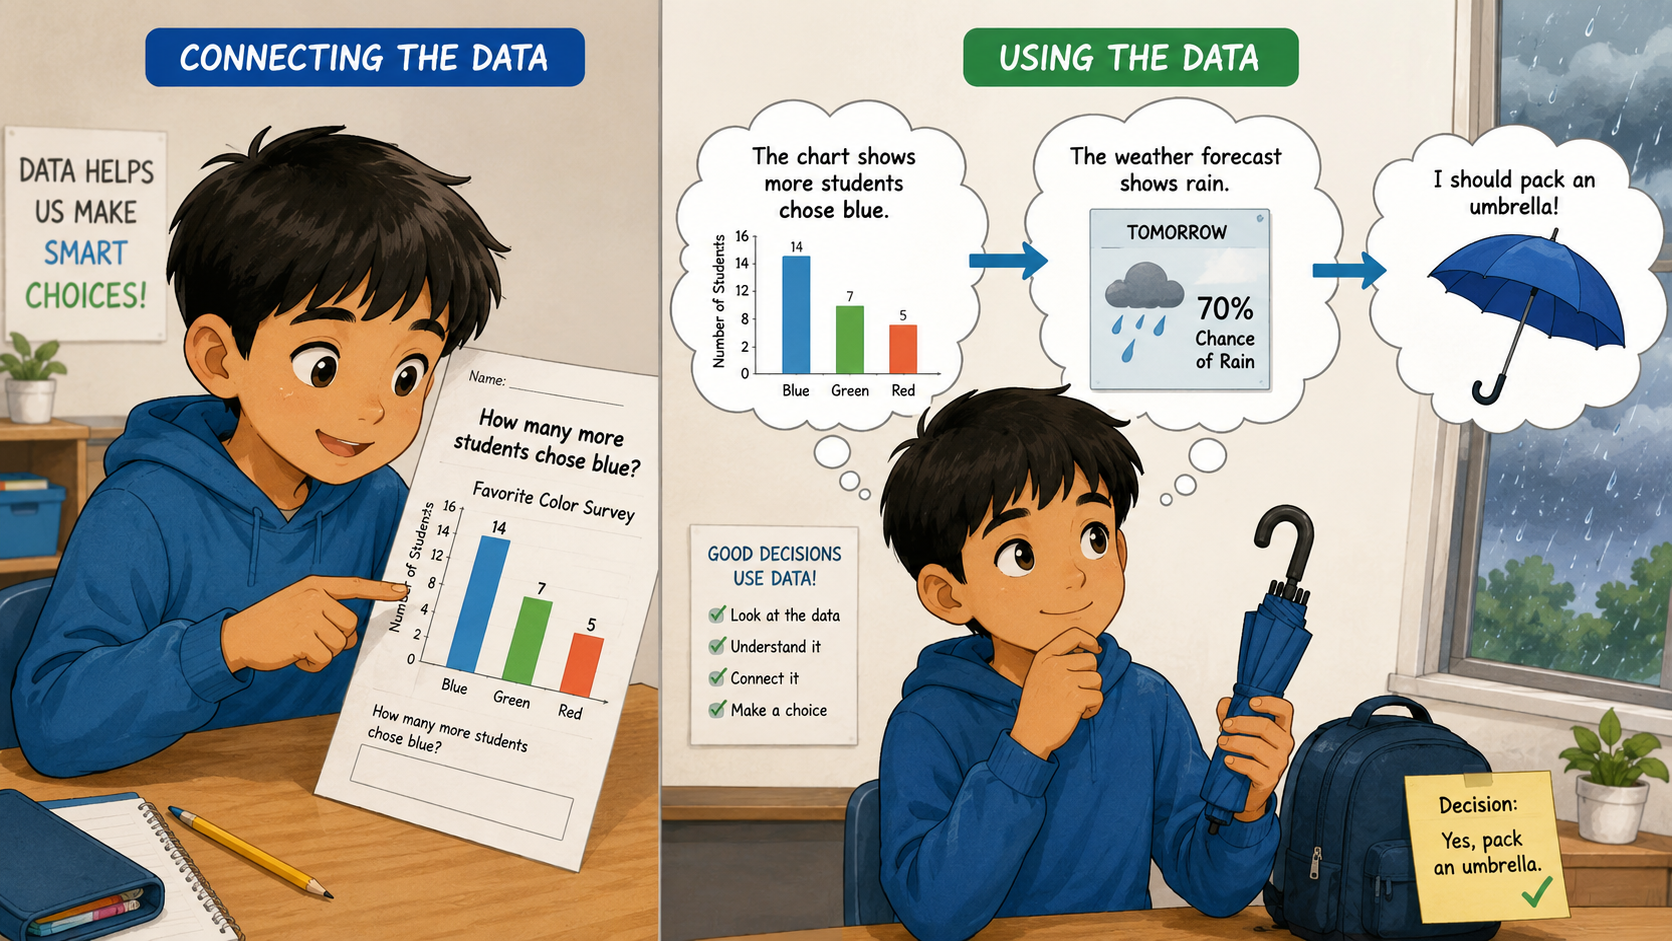
- Reading specific values: "How many students chose blue?"
- Comparing quantities: "Which category had more, and by how much?"
- Identifying highs and lows: "What was the maximum temperature?"
- Calculating simple statistics: "Find the mean of these numbers."
These are important foundational skills. But they stop at description. They ask students to extract what is literally on the chart, not to interpret what it means, evaluate its trustworthiness, or use it to make a decision. This surface-level approach is reinforced by many curricular materials, state assessments, and even widely cited standards.
The Common Core State Standards for Mathematics, for example, include standards for summarizing and describing data distributions.
In many classrooms, these standards are addressed through procedural tasks such as drawing a box plot, calculating the interquartile range, or finding the mean absolute deviation (based on Chart-Ed's internal analysis of commonly used curricula). The reasoning—Why does this distribution look this way? What does this outlier suggest?
Should we trust this data? —is frequently left unasked.
The Hard Part: Reasoning, Evaluating, Deciding
The "hard part" of data literacy is not a mystery. It's the set of skills that turn data into insight:
- Interpreting: What story does the data tell? What might explain the patterns?
- Evaluating: Is the data reliable? Was the sample biased? Is the chart misleading?
- Deciding: Given what we know, what should we do? What are the trade-offs? What additional information would strengthen our conclusion?
These skills align with the statistical investigation cycle described in the GAISE II framework (American Statistical Association, 2020): formulate questions, collect data, analyze, and interpret. Yet in many classrooms, interpretation is reduced to "read the chart" and evaluation and decision-making are omitted entirely. Why does this happen?
Time pressure, lack of ready-made reasoning tasks, and assessments that don't require justification all play a role. Teachers may feel they are checking the box for data literacy if students can compute and read accurately. But standards bodies and international assessments tell a different story.
Why the Gap Matters
Evidence from international assessments, including the OECD's PISA 2018, suggests that many 15-year-olds can accurately read data points from graphs but grapple with tasks that require them to interpret trends, evaluate data quality, or apply results to new settings (OECD, 2019).
These results mirror what experienced educators observe: students often leave school able to read a chart but not to think with data. This gap may have real-world consequences.
In a world saturated with data and infographics, limited data literacy can leave individuals less equipped to evaluate information critically, potentially increasing their vulnerability to misinformation and weakening their ability to participate in data-informed civic life.
While research directly linking shallow school data tasks to these broader outcomes is still evolving, the logical connection is strong enough to warrant attention.
The GAISE II framework and NCTM’s Catalyzing Change call for a shift toward reasoning and statistical thinking, but translating that vision into daily classroom practice requires more than good intentions. It requires concrete examples of what reasoning tasks look like and how to design them.
What Full Data Literacy Looks Like
Full data literacy is not about adding more statistics content; it's about transforming how we ask students to engage with data. Instead of stopping at "What is the average?", we continue to:
- Contextualize: What does this average mean for this specific situation?
- Critique: Is the average the right measure here? Does it hide variation?
- Apply: If this average holds, what would you predict for next year? What actions would you recommend?
This vision is not new, but it remains rare in classrooms because it demands different types of materials and assessments. Teachers need tasks that scaffold reasoning, not just reading. They need rubrics that value explanation and justification alongside numerical accuracy. And they need models of what such lessons can look like across subjects.
Examples: Before and After
To make the shift tangible, consider these side-by-side transformations.
Mathematics: Middle School Data Unit
- Surface-level task: The bar graph shows the number of books checked out each month. How many more books were checked out in March than in February?
- Reasoning task: The bar graph shows library book checkouts by month from September to June. What patterns do you notice? Based on the data, when would you recommend the library schedule additional reading events? Justify your recommendation using evidence from the graph. What additional data would help you make a stronger recommendation?
Science: High School Experiment
- Surface-level task: Look at the graph of plant growth under three light conditions. What was the average height of plants in the Low Light group?
- Reasoning task: The graph shows the final plant heights for three light conditions. Do the results support the claim that plants grow best under Medium Light? Explain your reasoning, including whether you see enough evidence to draw a firm conclusion. What improvements to the experiment would increase your confidence?
Everyday Data: Cross-Curricular
- Surface-level task: The infographic shows how much plastic waste different countries produce. Which country produced the most plastic waste?
- Reasoning task: This infographic displays total plastic waste by country. What does the graphic not tell you that would be important for comparing countries fairly, such as population size or recycling rates? If you were a policymaker, what additional data would you request before setting new regulations?
In each case, the reasoning task demands that students go beyond the obvious numbers: they must notice patterns, consider limitations, and articulate a position backed by evidence. These are the moves that develop responsible data reasoning.
Moving from Reading to Reasoning in Your School
For curriculum leaders, closing this gap starts with a simple audit.
Audit Your Current Materials
Take a unit you already teach. Scan each data-related activity or assessment item. How many questions ask students only to read a value or compute a statistic? How many ask them to interpret, evaluate, or decide? You may find that the reasoning questions count toward a small fraction, or none, of the total.
Look for Reasoning-Rich Resources
When evaluating new materials, ask publishers and developers: "Where are the tasks that require students to justify their interpretation? Where are the prompts that ask them to critique the data or the chart itself?" If the answer is a vague "critical thinking is woven throughout," push for concrete examples.
Scaffold Reasoning in Your Classroom
You don't need to rewrite your entire curriculum. Start by adding one reasoning extension to an existing data task. For instance, after students find the median, ask: "What does this median reveal about the situation? What would it mean if the median were much higher or lower?" Model how to write a justification sentence that uses data as evidence.
Assess Reasoning Explicitly
Create or adopt a simple reasoning rubric. For example: "Student provides a claim, supports it with data from the chart, and acknowledges a limitation or alternative explanation." Share this rubric with students so they know what deep engagement looks like.
The Opportunity for Curriculum Leaders
The gap between reading charts and reasoning with data is not a sign of failure—it's an invitation to design better learning experiences. Every teacher has seen that moment when a student can state the bar height but can't say what it means. The gap is known, and it is bridgeable. Chart-Ed exists to support that bridge-building.
Our task design platform helps teachers craft reasoning-rich prompts without starting from scratch. Our reasoning rubrics make it feasible to assess the hard part consistently and fairly. These tools are not magic; they are scaffolds that make the shift practical and sustainable.
As a curriculum leader, you are in a unique position to move the conversation from "we cover graphs" to "our students reason with data." It begins with looking honestly at your current materials, envisioning the deeper goal, and taking one concrete step toward tasks that demand more from students—and give them more in return.
The hard part is precisely where the real learning lives. Let's teach it together.
References
- OECD. (2019). PISA 2018 Results (Volume I): What Students Know and Can Do. OECD Publishing.
- Bargagliotti, A., Franklin, C., Arnold, P., Gould, R., Johnson, S., Perez, L., & Spangler, D. A. (2020). Pre-K–12 Guidelines for Assessment and Instruction in Statistics Education II (GAISE II). American Statistical Association.
- National Governors Association Center for Best Practices & Council of Chief State School Officers. (2010). Common Core State Standards for Mathematics.
- National Council of Teachers of Mathematics. (2018). Catalyzing Change in High School Mathematics: Initiating Critical Conversations. NCTM.
- Chart-Ed internal analysis of K–12 data tasks from published curricula and assessment banks (unpublished). Used to inform observations about typical task design.