What Students Need Before Data Analysis
Introduction: The Overlooked Foundation
Every data task in K‑12 classrooms starts with a chart, a table, or a graph. We hand it to students and ask, “What do you notice? What can you conclude?” We expect them to make sense of the data—to interpret, to argue, to reason. But many students aren’t ready for that leap.
Before they can analyze, they need to see the display as a set of deliberate choices: a title, axes, labels, units, scale. They need to spot patterns and ask tentative questions before jumping to answers. These pre-analysis moves are the overlooked foundation of data literacy.
This article gives teachers, coaches, and curriculum leaders a clear, practical framework for building that foundation. We’ll explore three pre-analysis moves—Orienting, Noticing Structure, and Forming Preliminary Questions—and show you how to weave them into daily instruction.
The ideas are grounded in research where it exists, and honest about where classroom evidence is still growing.
Why Jumping to Analysis Backfires
Picture a fifth‑grade class looking at a bar graph of monthly rainfall. A student eagerly raises a hand: “March had the most rain!” But the horizontal axis shows months from June to May, and the tallest bar isn’t March—it’s November. The student rushed past orientation and misread the axis.
Misinterpretations like this are common because many curricula treat graph reading as automatic, skipping the deliberate looking that makes sense of representations. Cognitive research underscores why this matters.
Shah and Hoeffner (2002) found that when learners are explicitly directed to attend to graph features—titles, axes, legends, scales—their interpretation accuracy improves significantly. Curcio (1987) identified three levels of graph comprehension, beginning with “reading the data” directly from the display.
Without that initial orienting step, students may never reach deeper analysis. Yet typical textbook prompts often leap straight to quantitative comparison or argument, leaving what many practitioners describe as a silent readiness gap. This gap isn’t a student deficit—it’s an instructional design choice that can be changed.
The Pre-Analysis Framework: Three Moves
We call the critical pre‑analysis sequence Orient → Notice Structure → Form Preliminary Questions. Done deliberately before any analysis, these moves give every student an on‑ramp. 
1. Orienting
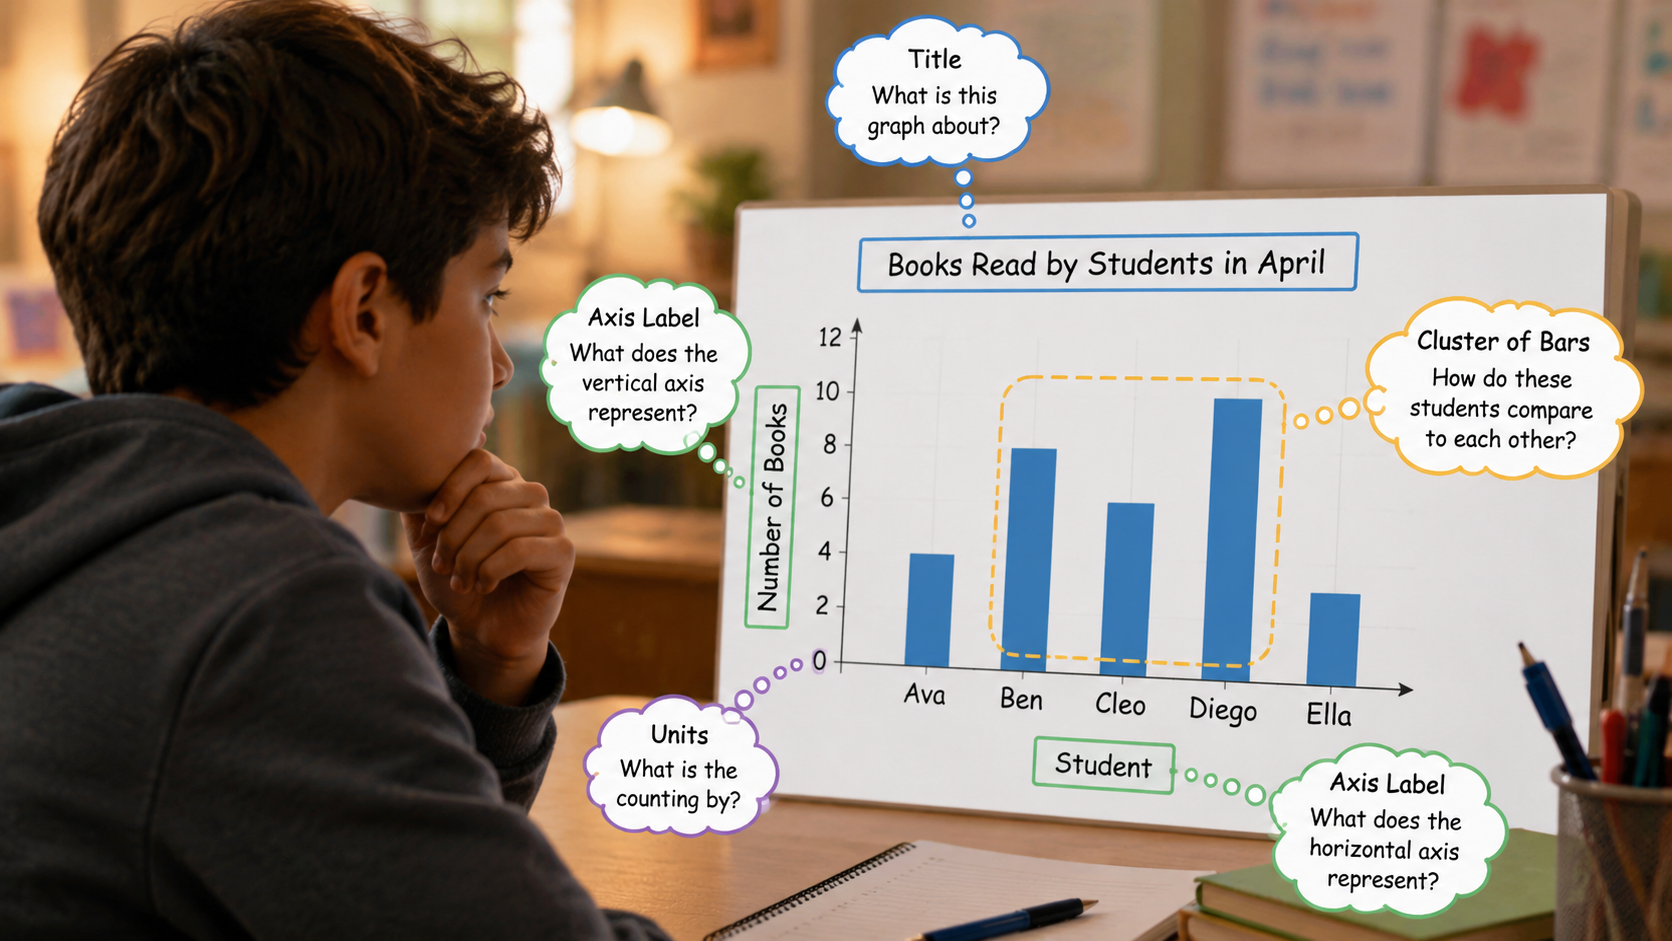
What exactly am I looking at? Students scan the display and identify its components:
- Title: What is this graph about?
- Axes/Legend: What variables are shown? What units?
- Scale: How are the numbers spaced?
- Graph type: Is it a bar graph, line graph, scatterplot, or something else? Example: Look at the sample graph below. Before asking anything else, a student should be able to say: “This is a bar graph titled ‘Monthly Library Books Checked Out, 2025.’ The horizontal axis shows January to December; the vertical axis shows number of books from 0 to 200. The bars get taller in summer and shorter in fall.”

2. Noticing Structure
What patterns, clusters, or surprises do I see? Without computing anything, students observe:
- Overall shape or trend (increasing, decreasing, flat)
- Peaks and valleys
- Clusters or grouping of data points
- Outliers or gaps This step bridges from surface reading to informal inference. It primes students to make comparisons and ask deeper questions later. For example, “The number of books checked out rises from winter to summer, then drops after August. December is the lowest, but there’s a small bump in September.”
3. Forming Preliminary Questions
What do I wonder now that I’ve oriented and noticed? With the display fresh in mind, students generate questions that focus their upcoming analysis. These aren’t final claims—they’re investigative starting points. For instance:
- Why might books checked out increase in the summer?
- Why is there a jump in September?
- Is the pattern similar for other libraries? Asking questions here reduces the cognitive load during later analysis (Ben‑Zvi & Garfield, 2004) and aligns with inquiry‑based learning research showing that student‑generated questions deepen engagement (Minner et al., 2010).
What the Research Says
The three‑move framework draws on a mix of direct evidence and adjacent research. Direct evidence: Studies by Shah and Hoeffner (2002) and Curcio (1987) show that explicit attention to graph components reduces interpretation errors. Friel et al.
(2001) synthesized decades of work identifying structural factors—such as graph type and labeling—that influence student understanding. These studies support the orienting and noticing moves specifically. Adjacent evidence: The emphasis on question formulation echoes findings from inquiry‑based science (Minner et al.
, 2010) and statistical reasoning (Ben‑Zvi & Garfield, 2004), where exploratory phases improve later performance. Cognitive load theory further justifies off‑loading orientation and noticing into a separate phase so students can devote full working memory to analysis.
What we don’t yet know: Most direct studies are short‑term and involve older learners; large‑scale K‑12 trials of explicit pre‑analysis instruction are scarce. The specific three‑step sequence we describe is a synthesis of developmental theory and practicing teachers’ insights, not a controlled comparison.
Promising as it is, its long‑term impact on students’ data argumentation quality is still being investigated. So this framework is well‑grounded, not fully validated—a practical bridge between promising research and everyday classroom need.
Classroom Routines That Build Pre-Analysis Muscle
Here are three routines, each aligned to a grade band and highlighting different pre‑analysis moves. Try one tomorrow.
Upper Elementary (Grades 3–5): Sticky‑Note Noticing
A teacher displays a bar graph of favorite school lunch choices. Before any discussion, each student writes three things they notice on a sticky note. The class then groups the noticings into categories: “labels and title,” “numbers and scale,” and “data patterns.” This routine builds shared vocabulary and forces deliberate orientation and noticing structure. After sorting, the teacher asks, “Now what can we say about the data?”—and the conversation is grounded, not guesswork.
Moves practiced: Orienting, Noticing Structure.
Middle School (Grades 6–8): See‑Think‑Wonder for Graphs
A line graph of monthly rainfall over a year becomes the focus. Students use a graphic organizer with three columns:
- See: Describe exactly what’s on the graph (title, axes, units, highest point, lowest point).
- Think: Make a tentative claim based on what you see (e.g., “Rainfall is highest in spring”).
- Wonder: Generate a question you could investigate further. The “See” column forces pre‑analysis; without it, students often jump to “Think” conclusions that ignore scale or label details. The routine can be used repeatedly, with increasing sophistication.
Moves practiced: All three—Orienting, Noticing Structure, Forming Preliminary Questions.
High School (Grades 9–12): Graph Walk
In a biology class, students examine a scatterplot of plant height vs. fertilizer amount. Working in pairs, they complete a “Graph Walk”: physically point to and explain each axis, units, title, legend, and any outlier points. Only after this walk do they discuss possible relationships. The teacher circulates and clarifies misconceptions about scale or variable naming before any analysis begins. This protocol is quick, social, and ensures every student starts from accurate orientation.
Moves practiced: Orienting, Noticing Structure.
Teacher Professional Learning: Diagnosing with Pre‑Analysis
In a PLC, teachers examine a sample student response that misinterpreted a chart. They diagnose that the student skipped the orienting step and misread the axis labels. The group then co‑plans a mini‑lesson on “graph orientation,” teaching the Graph Walk routine. They plan to collect student work to monitor improvement. This reflective practice deepens the professional understanding of pre‑analysis as a teachable skill.
Implications for Teaching and Curriculum
Making pre‑analysis a habit doesn’t require abandoning your curriculum—it requires embedding a few intentional moves.
Make it a routine. Before every data task, open with a quick orienting prompt: “Take 30 seconds to scan the title, axes, and labels. Then jot down one thing you notice.” This becomes as automatic as a do‑now.
Teach explicitly with gradual release. Model the sequence with think‑alouds (“I do”), practice together on a new graph (“We do”), and then have students apply the routine independently (“You do”). Over time, students internalize the moves.
Assess formatively. Include pre‑analysis questions on exit tickets: “What does the horizontal axis of this graph represent? What pattern do you see?” These quick checks tell you whether the foundation is solid before you move to analysis.
Connect to standards. Aligning with math practice standards (MP1: Make sense of problems, MP5: Use appropriate tools strategically) and science/engineering practices (Asking questions, Planning and carrying out investigations) justifies the instructional time and helps curriculum leaders see pre‑analysis as a core skill, not an add‑on.
Curriculum leaders: Map pre‑analysis moves across units. In early grades, emphasize orienting; in middle grades, add noticing structure; in high school, integrate question formulation and argument preparation. A coherent vertical plan ensures students build these skills year after year.
Connecting to a Bigger Picture
Pre‑analysis isn’t an isolated trick—it’s the foundational phase of a developmental data literacy progression. Chart‑Ed’s Data Ascent framework maps this progression, showing how students climb from orienting to increasingly sophisticated reasoning.
The Data Math instructional approach provides classroom tools and strategies to support each rung of that ladder, including the pre‑analysis moves described here. If you’d like to explore further, those resources are designed to help. For now, the most powerful step is the one you take Monday morning.
Pick one routine from this article—Sticky‑Note Noticing, See‑Think‑Wonder, or a Graph Walk—and try it. Watch what happens when students pause, look closely, and build a mental picture of the data before anyone asks for an answer. That pause is where data literacy begins.