Teaching Students to Say “We Cannot Tell”
Introduction: The Silence After the Chart
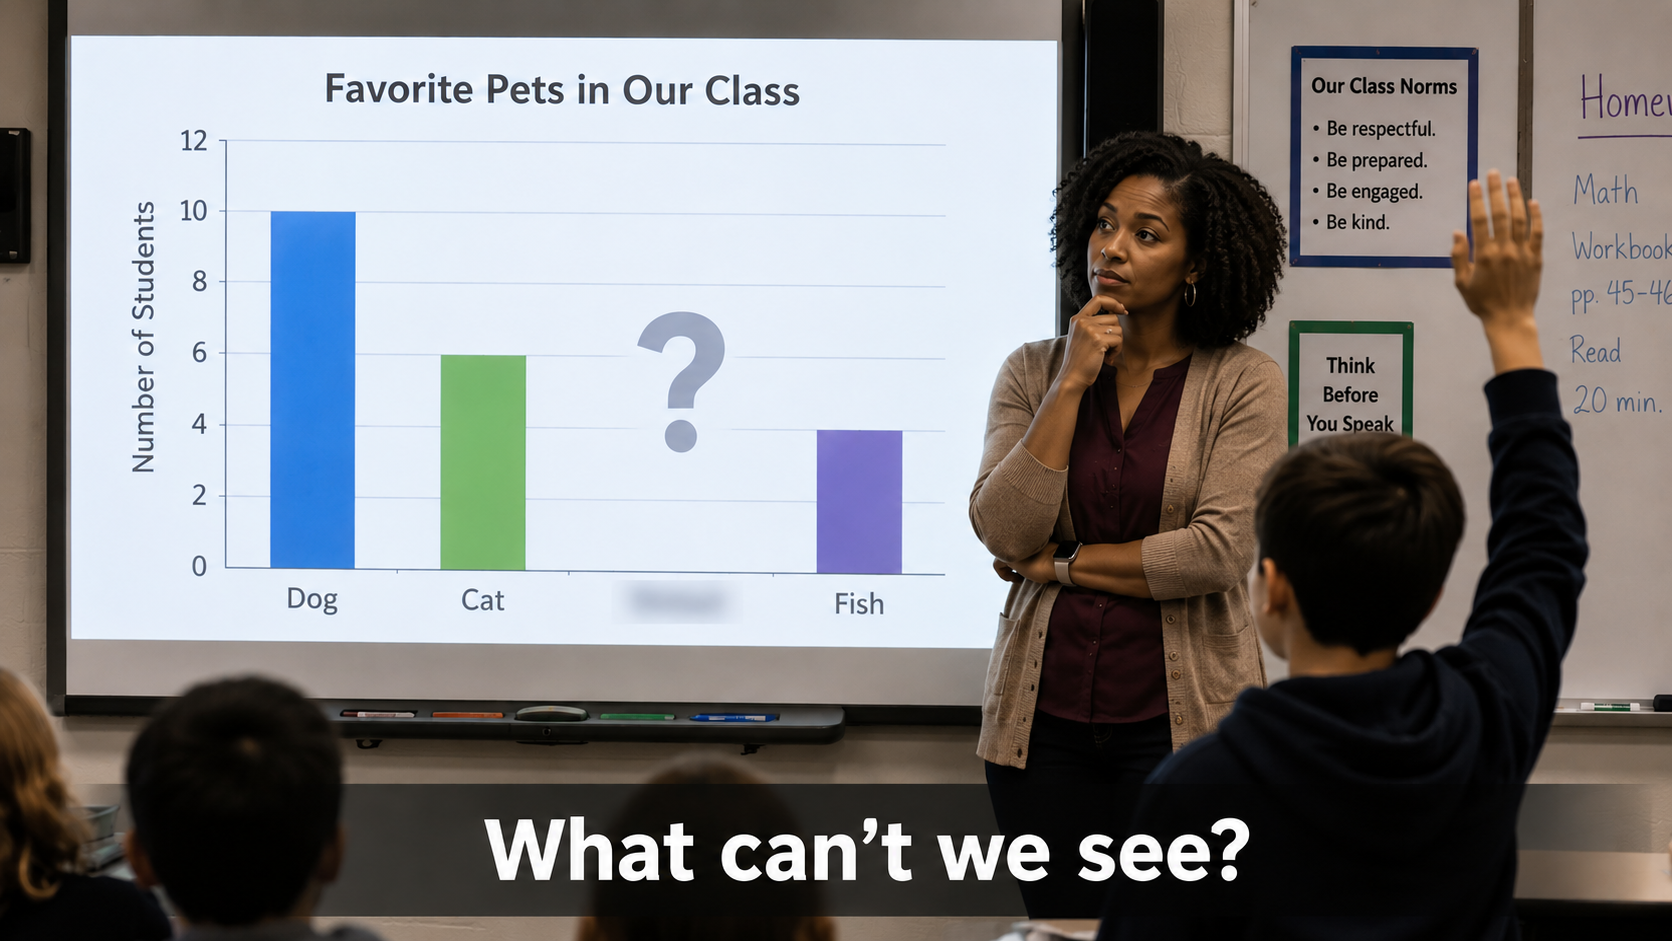
You’ve just shown your class a chart. It might be a bar graph of class survey results, or a line graph tracking temperature changes. You ask, “What do you notice?” Hands go up. Students eagerly describe what they see: “The blue bar is tallest.” “The line goes up.” Then, you ask a different question: “What can’t you tell from this chart?”
The room falls silent. That silence is a signal — not of failure, but of an opportunity. Teaching students to say “we cannot tell” transforms that quiet into a powerful academic move, one that builds critical data literacy and intellectual humility.
In this article, we’ll explore practical strategies, classroom culture shifts, and evidence-informed guidance to make uncertainty a valued part of your students’ thinking.
Why “We Cannot Tell” Matters More Than Ever
We live in a world awash in charts and data visualizations. Social media feeds, news reports, and policy briefs all use graphs to persuade. Yet many of these visuals omit crucial context, hide assumptions, or present incomplete evidence.
Students who only learn to extract what a chart explicitly shows — without interrogating what it leaves out — are unprepared to navigate this landscape. The ability to say “This data doesn’t answer that question” or “We cannot tell from this evidence” is not a sign of weakness; it’s a hallmark of rigorous, evidence-based reasoning.
Research in science education and data literacy underscores this point. Duschl and Grandy (2013) help frame explicit attention to the limits and uncertainty of evidence as part of epistemic development in science learning. Rubin (2020) frames data reasoning as including attention to what data can and cannot answer.
Kjelvik and Schultheis (2019) offer classroom-relevant evidence for working with authentic, messy data, a context in which ambiguity and incomplete information become part of students’ reasoning work.
Even general data literacy frameworks, such as Mandinach and Gummer (2016), position careful interpretation, question-asking, and attention to limits as part of educator data literacy. When we normalize uncertainty, we teach students that intellectual honesty is more valuable than premature certainty.
The goal is not to paralyze inquiry but to strengthen it by acknowledging its boundaries.
What the Research Tells Us (and What It Doesn’t)
Before diving into classroom routines, it’s important to look at the evidence base honestly. No large-scale study has tested the exact phrase “we cannot tell” as an instructional intervention. However, converging lines of research give us confidence in its benefits.
- Graph comprehension: Friel, Curcio, and Bright (2001) show that graph comprehension depends on factors such as labels, scales, missing information, and students’ ability to connect visible patterns to meaning. Explicit instruction is needed to address these blind spots.
- Teacher modeling: Work on teacher noticing, including Sherin, Jacobs, and Philipp (2011), suggests that the language teachers model can shape the kinds of evidence-sensitive observations students learn to make. Saying “I wonder what happened before this data point” or “I can’t tell from this chart whether…” models intellectual humility.
- Productive struggle: The National Council of Teachers of Mathematics (NCTM, 2020) advocates for classrooms where sense-making, including grappling with confusion, is a valued practice. Naming what we don’t know is a key part of that struggle.
- Authentic messy data: Kjelvik and Schultheis (2019) show how authentic scientific data can support student data literacy, especially when students must reason through information that is not perfectly tidy. Such tasks make “I can’t tell yet” a natural, and not a failing, response. Critically, the existing research is mostly small-scale, qualitative, or conceptual. Most studies were conducted in specific contexts, and cultural norms around expressing uncertainty vary widely. Some students may feel uncomfortable admitting ignorance. Teachers themselves may need support in navigating their own discomfort with data; a practical starting point is to practice the routine first with a familiar chart they have already taught. Despite these limits, the evidence consistently points toward the same conclusion: making uncertainty visible in the classroom is a promising practice worth trying. As always, we encourage you to adapt these strategies, observe your students, and share what you learn.
Building the “We Cannot Tell” Muscle: Core Instructional Routines
Moving from research to practice, here are four concrete, repeatable routines that help students practice acknowledging uncertainty daily. They are accessible to start and rich enough to deepen over time, making them adaptable across grade bands and subject areas.
Routine 1: 3-2-1 Chart Scan
This quick structure makes “cannot tell” a required observation, not an afterthought.
- 3 things you see in the chart (direct observations)
- 2 questions you have (curiosities, what you wonder)
- 1 thing you cannot tell from the chart (a limit or missing piece)
Teacher modeling script: “Let’s look at this chart together. I see that the number of rainy days increased from June to July. That’s one thing I see. I wonder why July has more rain — that’s a question. And one thing I cannot tell is whether the rainy days were light drizzles or thunderstorms. What do you see? What can you not tell?”
Routine 2: Evidence Audit
Using a simple checklist adapted from Chart-Ed’s Data Forensics framework, students examine a chart for:
- Source: Who made this? Is the source reliable?
- Data Collection: How was the data gathered? When? From whom?
- Completeness: Are any categories, time periods, or variables missing?
- Scale: Is the y-axis consistent? Does it start at zero? Are there breaks?
After the audit, students complete the sentence: “We cannot tell _________ because _________.”
Routine 3: Chart Pairing
Present two versions of a similar chart: one that is transparent and well-labeled, and another that is intentionally incomplete (e.g., missing a category, unclear scale, no source). Ask students to identify what they can conclude from each, and what each leaves unknowable. This comparison makes the role of missing information concrete.
Routine 4: Uncertainty Wall
Designate a bulletin board or digital space for sticky notes headed “We cannot tell…” When students encounter a chart — in science, social studies, or current events — they post what the chart cannot reveal. Celebrate the posters regularly, and use them as discussion starters.
Shifting Classroom Culture: From “I Don’t Know” to “We Cannot Tell Yet”
Routines are only half the story. For students to embrace uncertainty, they must feel safe and valued when naming limits. Here’s how to build that culture.
- Celebrate uncertainty-aware contributions. When a student says “We can’t tell if the trend continues after 2015 because the data stops,” respond with, “That’s a sharp limit to notice. Strong thinking.” This shifts academic status from “knowing all the answers” to “noticing what the evidence actually shows.”
- Replace deficit language. Instead of “I don’t know” (which can feel like a personal failure), teach students to reframe: “This chart does not show ___.” The focus moves from the learner’s knowledge to the data’s limitations.
- Adjust feedback criteria. Add a line to your rubric or exit ticket: “Identifies limits of the evidence.” Even a simple check mark signals that this skill matters.
- Make space for cultural responsiveness. In some communities, openly admitting uncertainty may conflict with cultural expectations. Start with small-group or pair discussions before whole-class sharing. Provide sentence stems: “Based on this data, we cannot tell if ____. What do you think we need to know?”
- Connect to larger goals. Intellectual humility, critical thinking, and scientific habits of mind are not just nice-to-haves; they are essential for democratic participation. As NCTM (2020) emphasizes, sense-making must become a classroom norm.
Real Classroom Snapshots: Three Scenarios Across Grade Levels
Let’s see what these routines look like in practice, from elementary to high school.
For K-2, use picture graphs or concrete classroom counts, and let students answer verbally before asking for written explanations.
Elementary (Grades 3-4): Missing Categories
The teacher displays a bar graph titled “Our Class’s Favorite Fruits,” showing apples, bananas, and grapes. A student asks, “What about oranges?” The graph has no orange bar. Teacher prompt: “Can we tell from this graph how many students chose oranges?” Students chorus, “No!” Follow-up: “What would we need to add to the graph to be sure?” Students brainstorm: maybe oranges weren’t an option, or the data weren’t recorded. The class lists things the graph cannot tell them. “We cannot tell” becomes a celebrated observation.
Middle School (Grades 6-8): Ambiguous Poll
Students examine a graphic claiming “67% of voters support the policy,” with fine print reading “n=100, margin of error ±9%.” No demographic breakdown is shown. Teacher prompt: “What does this poll definitely tell you? What does it definitely not tell you?” Small groups create a T-chart. Reflection: Students realize, “We cannot tell if this result holds for the whole population because of the small sample and large margin of error.” The teacher reinforces that this is evidence-based skepticism, not a dismissal of the poll.
High School (Grades 10-12): Overlapping Error Bars
A biology graph compares plant growth under two light conditions. Error bars overlap at several time points, but the caption says “Group A grew significantly more.” Teacher prompt: “Based on what you see in the graph, can we tell if the difference is statistically significant?” Student answer: “From the visual alone, we cannot tell because the error bars overlap; we would need the statistical test results.” The class discusses how to responsibly report uncertainty, and how captions can mislead.
Weaving in Chart-Ed Resources: Chart Bank, Data Forensics, and Beyond
You don’t have to create everything from scratch. Chart-Ed provides free, classroom-tested resources designed to support exactly these routines.
- Data Forensics framework: This ready-to-use question set guides students through source evaluation, data collection scrutiny, and missing-data detection. Print it as a laminated card or project it for whole-class audits.
- Chart Bank: A growing library of curated charts, including many that intentionally contain ambiguity, missing categories, or distorted scales. Search for terms like “missing categories” or “ambiguous trends” to find perfect images for your lessons.
- Chart Evidence Routines: Many of the strategies in this article, including 3-2-1 scans and evidence audits, are drawn from Chart-Ed’s broader approach to evidence-centered chart reading.
- Original blog post: If you’re new to this topic, Chart-Ed’s earlier piece “The Unanswered Questions in Your Charts” provides a shorter, introductory take. These routines can be adapted for science, social studies, math, or media literacy.
Frequently Asked (and Honest) Questions
“Won’t this slow down my pacing?”
Initially, yes, because you’re teaching a new skill. But routines like the 3-2-1 scan become faster with practice, and the deeper analysis pays off in richer discussions and fewer misunderstandings.
“What if students use ‘we cannot tell’ as an excuse not to try?”
Require evidence for the claim. A student must say, “We cannot tell ___ because ___.” Without a because-clause, it’s just a shrug. This turns it into a high-level reasoning move.
“Is this just for data and charts?”
No. The habit of asking “What can I not tell from this source?” transfers beautifully to texts, videos, arguments, and media. It’s a universal critical-thinking disposition.
“How do I grade this?”
You don’t need to score it; sometimes a check for participation is enough. For formal work, add a line to your rubric: “Identifies limits of evidence.” That simple addition reinforces its importance without punitive pressure.
Start Small, Think Big: A Five-Day Challenge for Your Classroom
Ready to try it out? Here’s a low-prep, five-day plan.
- Day 1: Introduce “One Thing We Cannot Tell” as an exit ticket after a data-related lesson.
- Day 2: Model your own uncertainty aloud while analyzing a chart. Use the phrase, “I can’t tell from this chart…”
- Day 3: Use a Chart Bank image for a 3-2-1 scan. Display the results.
- Day 4: Lead an evidence audit on a familiar graph from a textbook or news article.
- Day 5: Reflect as a class: How did it feel to say “we cannot tell”? What did we learn from the limits we noticed? Tweak the plan to fit your context. The goal is momentum, not perfection.
Conclusion: The Most Honest Answer
That silence after you ask “What can’t you tell?” is not empty; it’s full of possibility. When we teach students to name uncertainty, we give them a tool for intellectual integrity. They learn that recognizing the limits of evidence is not a failure — it’s the foundation of genuine understanding.
In a world saturated with half-truths and selective data, the ability to say “we cannot tell” may be the most honest answer of all. We hope you’ll try these strategies and share your stories with us. Use Chart Bank, Data Forensics, and Chart-Ed’s evidence routines as starting points, then adapt the practice to the charts your students already encounter.
References
- Chart-Ed. (n.d.). Data Forensics framework. Internal Chart-Ed resource referenced for route handoff.
- Chart-Ed. (n.d.). The Unanswered Questions in Your Charts. Internal Chart-Ed blog resource referenced for route handoff.
- Duschl, R. A., & Grandy, R. E. (2013). Two views about explicitly teaching nature of science. Science & Education, 22(9), 2109–2139.
- Friel, S. N., Curcio, F. R., & Bright, G. W. (2001). Making sense of graphs: Critical factors influencing comprehension and instructional implications. Journal for Research in Mathematics Education, 32(2), 124–158.
- Kjelvik, M. K., & Schultheis, E. H. (2019). Getting messy with authentic data: Exploring the potential of using data from scientific research to support student data literacy. CBE-Life Sciences Education, 18(2), ar24.
- Mandinach, E. B., & Gummer, E. S. (2016). Data literacy for educators: Making it count in teacher preparation and practice. Teachers College Press.
- National Council of Teachers of Mathematics (NCTM). (2020). Catalyzing change in middle school mathematics: Initiating critical conversations.
- Rubin, A. (2020). Learning to reason with data: How students can work with data to answer questions and solve problems. Harvard Education Press.
- Sherin, M. G., Jacobs, V. R., & Philipp, R. A. (Eds.). (2011). Mathematics teacher noticing: Seeing through teachers’ eyes. Routledge.